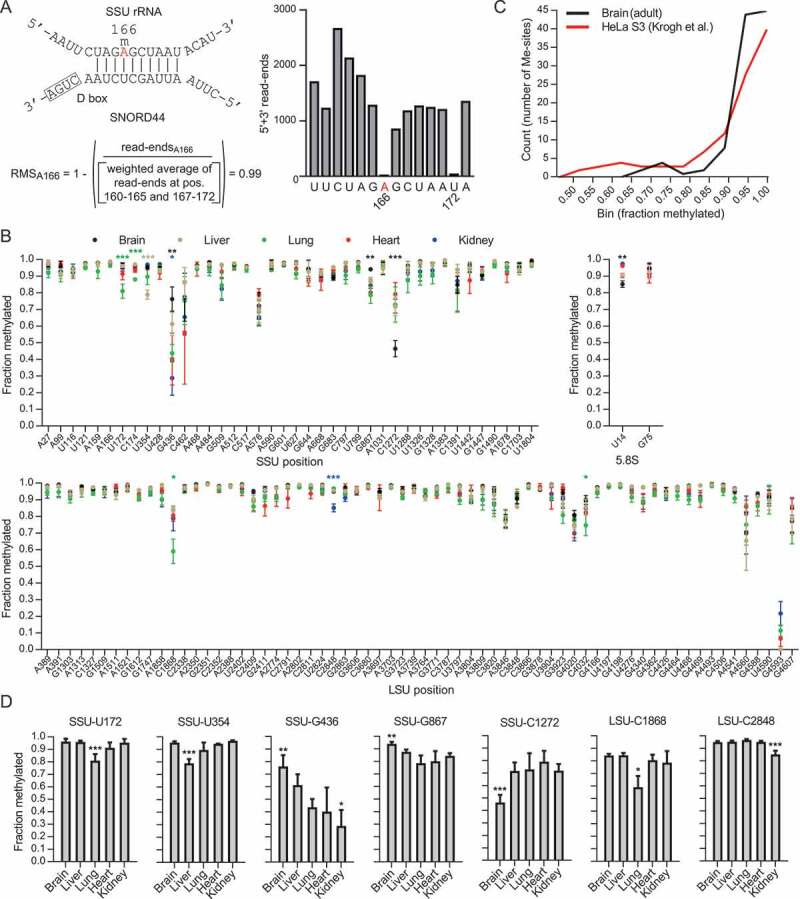
Figure 1.

(A) The principle of RiboMeth-seq analysis and calculation of RiboMeth-seq score (RMS) illustrated by analysis of SSU-Am166 (labelled in red). The modification is guided by SNORD44. The RNA is partially fragmented by alkaline that results in cleavage at all positions except those that are resistant to activation of the 2ʹOH due to methylation. RNA fragments are cloned and sequenced and the number of read-ends recorded. Based on this, a score is calculated by comparison of the read-ends at the queried position and that of a weighted average of six flanking positions at either side. The score describes the fraction of molecules methylated at the queried position. Note that the flanking sequence includes SSU-U172 that is also methylated. (B) Graph showing methylation scores at all methylated positions in mouse rRNA in five adult tissues. Sites are numbered according to human rRNA to allow comparisons. The mouse positions can be found in Table S3. (C) Comparison of the distributions of methylation scores in HeLa cells and mouse adult brain. (D) Examples of differentially methylated sites between adult tissues. Asterisks indicate levels of statistical significance when comparing the tissue in question to all other tissues.
