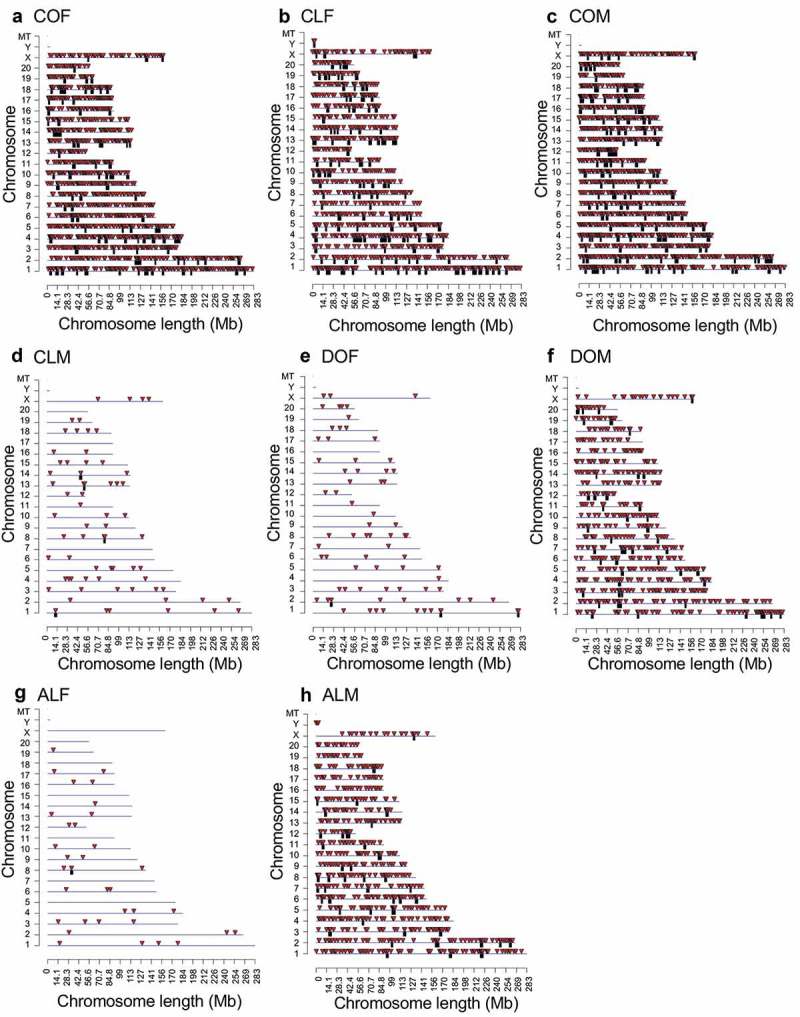
Figure 2.

DMR chromosomal locations. The DMR locations on the individual chromosomes for all DMRs at a p-value threshold of <1e-05. (a) Control obese female DMRs. (b) Control lean female DMRs. (c) Control obese male DMRs. (d) Control lean male DMRs. (e) DDT obese female DMRs. (f) DDT obese male DMRs. (g) Atrazine lean female DMRs. (h) Atrazine lean male DMRs. Red arrowheads indicate positions of DMRs and black boxes indicate clusters of DMRs.
