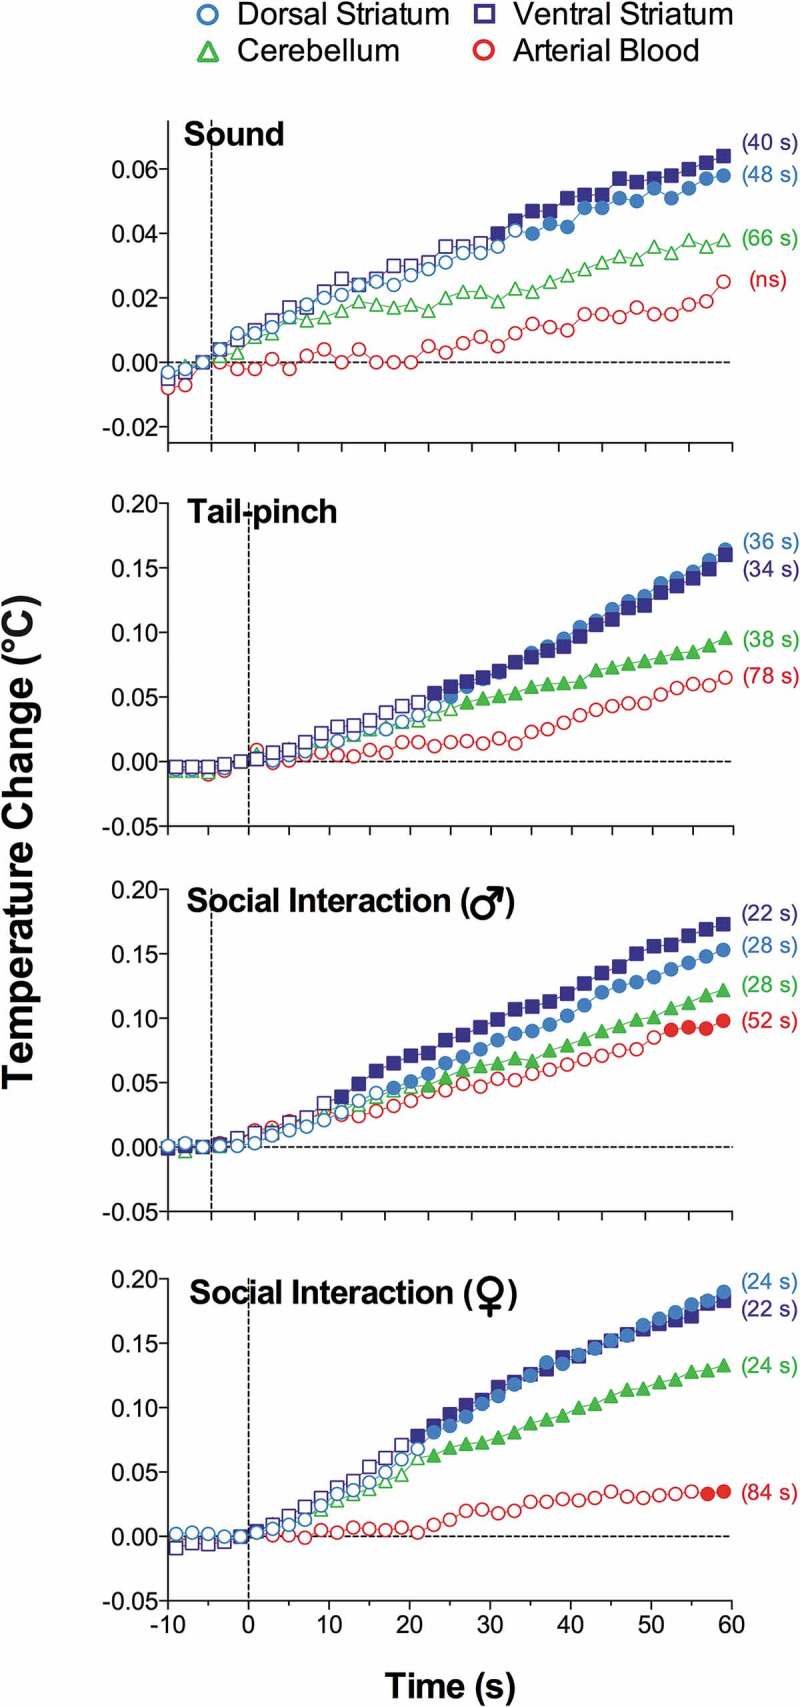
Figure 2.

Onset latencies of temperature responses to different environmental challenges in brain structures and arterial blood in freely moving rats. Mean values are shown at 2-s intervals for 10 s before and 60 s after the onset of each stimulus. Filled symbols indicate values significantly (one-way ANOVA followed by Scheffe test, p < 0.05) higher than the last pre-stimulus value. Response latencies were defined as the first significant value vs. baseline and shown in brackets. Data were replotted from reference [36].
