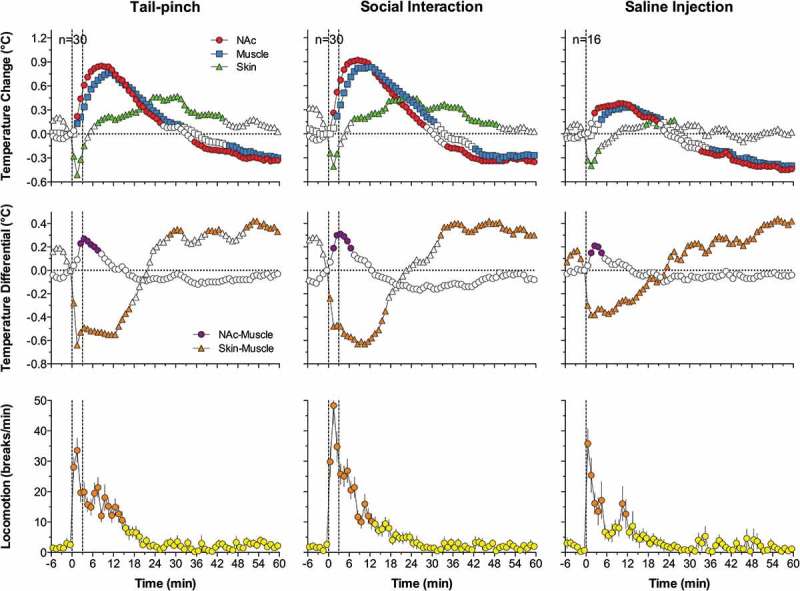
Figure 4.

Changes in brain (nucleus accumbens or NAc), temporal muscle, and skin temperatures during tail-pinch, social interaction, and subcutaneous saline injection. A = relative temperature changes; B = brain-muscle and skin-muscle temperature differentials; C = locomotor activity. Duration of stimuli is shown by vertical hatched lines. Filled symbols indicate values significantly (one-way ANOVA followed by Fisher test, p < 0.05) higher than the last pre-stimulus value. Compiled from original data published in [57].
