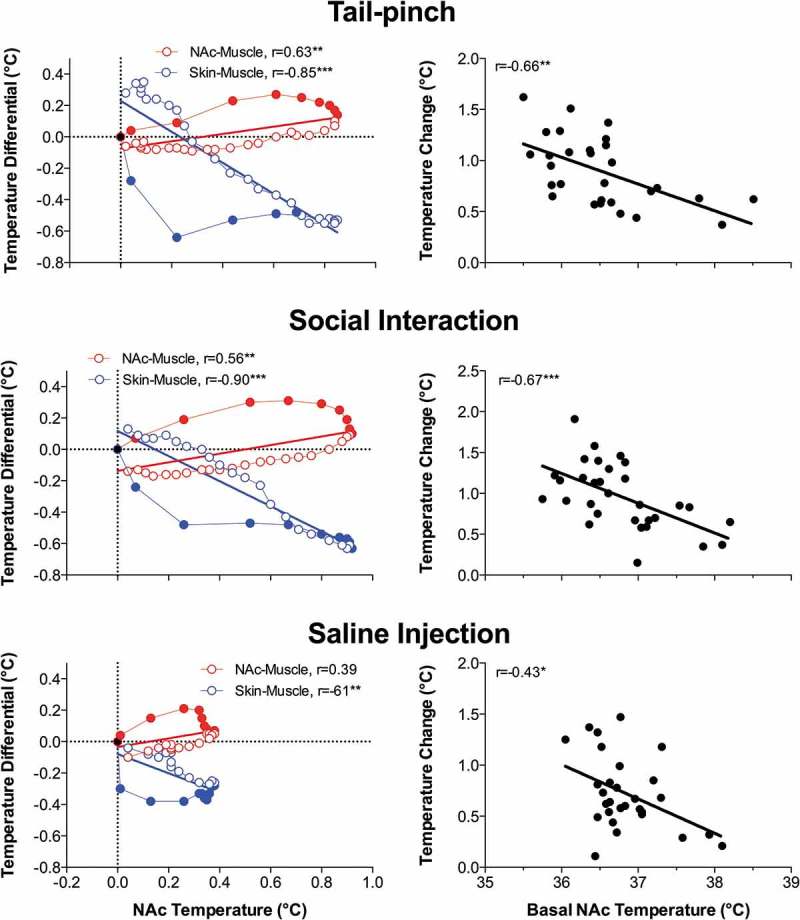
Figure 5.

Relationships between changes in NAc temperature and two temperature differentials (NAc-muscle and skin-muscle) during tail-pinch, social interaction and subcutaneous saline injection in freely moving rats. Graphs on the left side show time-dependent correlative relationships between changes in NAc temperature and two temperature differentials. In each case, increases in NAc temperature correlated with increases in NAc-muscle differentials and decreases in skin-muscle differentials. Graphs on the right side show that NAc temperature increases induced by each arousing stimulus were dependent on basal NAc temperatures; these responses were strong at low basal temperatures and progressively weaker at higher basal temperatures. Regression line crossed the line of no effect at ~39.0–39.5°C, suggesting upper limits for physiological brain temperature increase. Compiled from original data published in [57] and re-analyzed for this report.
