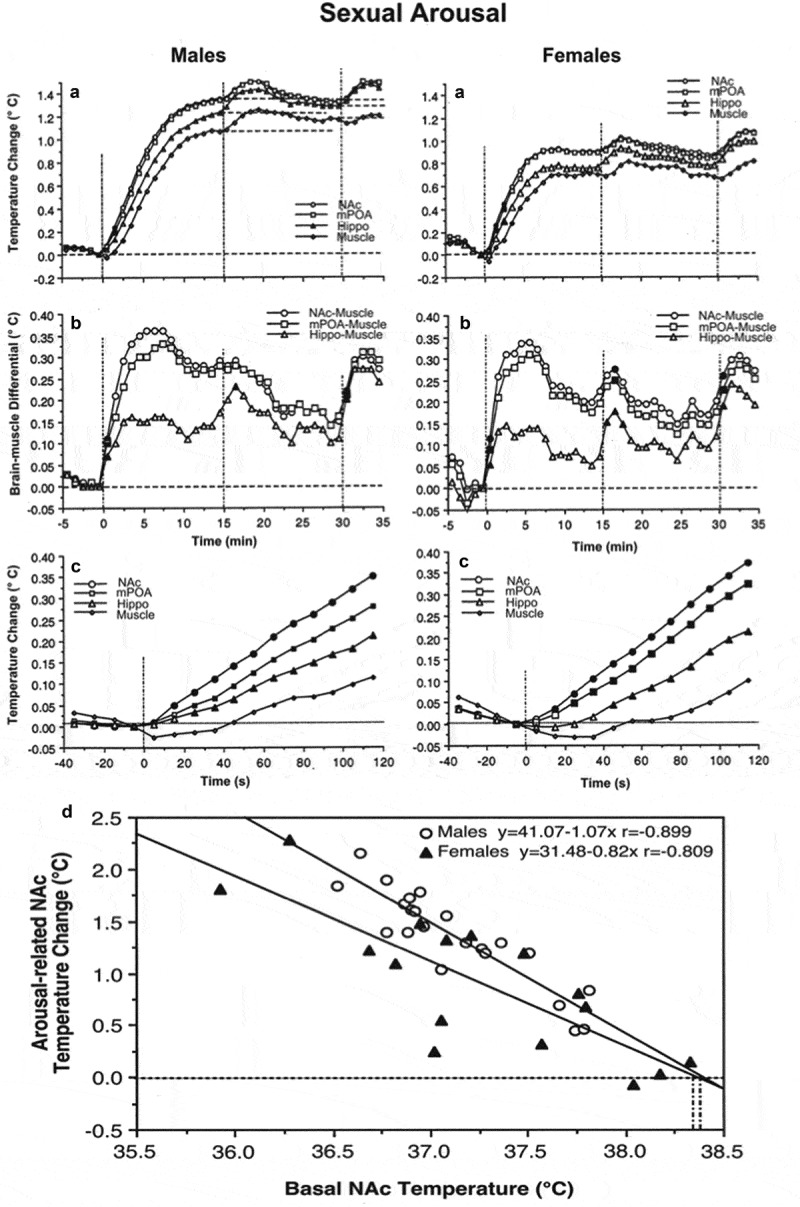
Figure 7.

Phasic changes in brain (NAc, mPOA, and Hippo) and muscle temperatures in male and female rats associated with sexual arousal preceding copulatory behavior. A and B = changes in relative temperatures and brain-muscle differentials for the 35 min after the start of sexual stimulation (vertical hatched lines show arousal 1, 2, and time of free interaction). Filled symbols show the first value significantly different (ANOVA with repeated measures followed by Scheffe test, p < 0.05) from baseline for each of three comparisons (arousal 1, arousal 2, and free interaction). C shows the initial period of stimulation (10-s bins for 120 s). In this case, filled symbols indicate all values significantly different from baseline. Bottom graph shows correlative relationships between the magnitude of NAc temperature increase induced by sexually arousing stimuli in male and female rats and basal temperatures. In both cases, correlation was highly significant (p < 0.01). Regression lines for both males and females cross the line of no effect at ~38.4°C, suggesting that the arousal-related brain temperature increase has its natural limits and disappears at high activity state. Data were obtained in 32 (seven rats) and 17 sessions (five rats) in males and females, respectively. Original data were published in [59,87] and replotted for this article.
