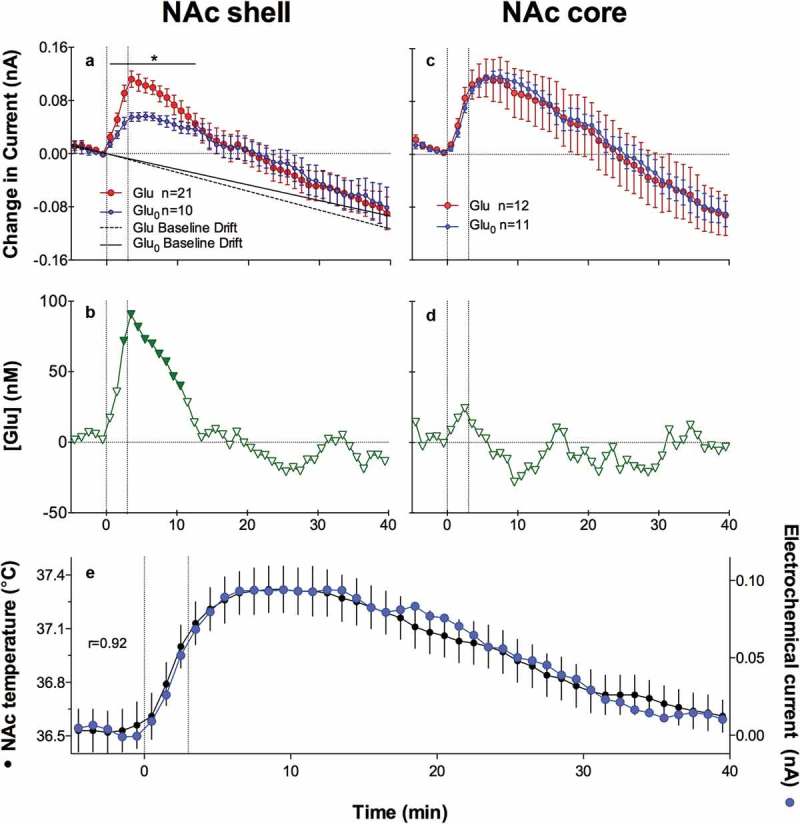
Figure 19.

Slow changes in electrochemical currents detected by GLU and GLU-null sensors in the NAc shell (left panel) and NAc core (right panel) during a 3-min tail-pinch in freely moving rats. Top row (A and C) shows mean (±SEM) changes in total currents detected by both types of sensors. Middle row (B and D) shows current differences (active – null) calibrated in nM GLU concentrations. The two vertical hatched lines in each graph show onset and offset of tail-pinch and horizontal hatched lines show baselines. Two diagonal lines in A show the trend in current baselines calculated for GLU and GLU-null sensors. Asterisks in A show the period of significant differences in currents (current x time interaction assessed with two-way ANOVA) detected by active and null sensors. Significant differences in currents (active – null) are shown in B as filled symbols. E shows mean(±SEM) changes in NAc temperature and electrochemical current detected by GLU-null sensors during 3-min tail-pinch. Original data were published in [174,177]; the picture was reproduced in [187] (ACS Chemical Neuroscience; open access publication).
