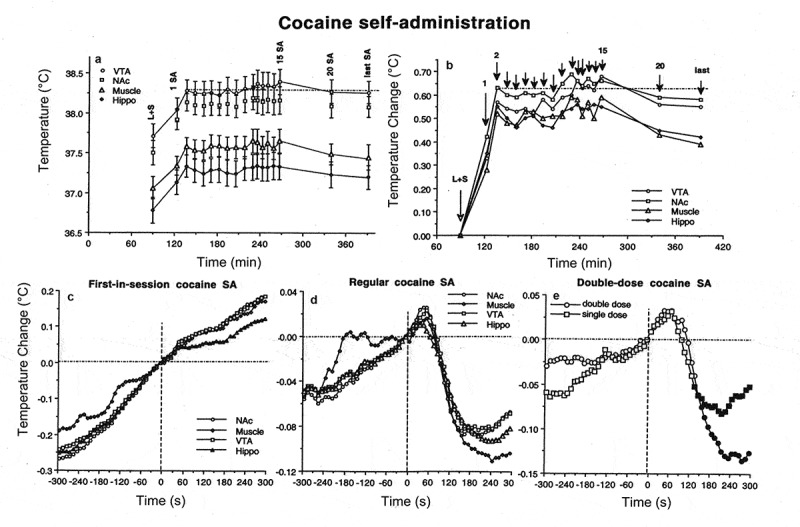
Figure 22.

Changes in brain (NAc, nucleus accumbens; VTA, ventral tegmental area of midbrain, Hippo, hippocampus) and muscle temperatures during cocaine self-administration in trained rats. A and B = changes in absolute and relative temperatures averaged for each consecutive cocaine self-injection. L + S, the moment of light+sound presentation, when the lever became accessible and the rat could press a lever. C = temperature changes associated with the first-in-session cocaine self-injection. D = temperature changes associated with regular cocaine self-injections. E = differences in NAc temperature changes after a typical single-dose (1.0 mg/kg) and double-dose (2.0 mg/kg) cocaine self-injections. Data were replotted from [223].
