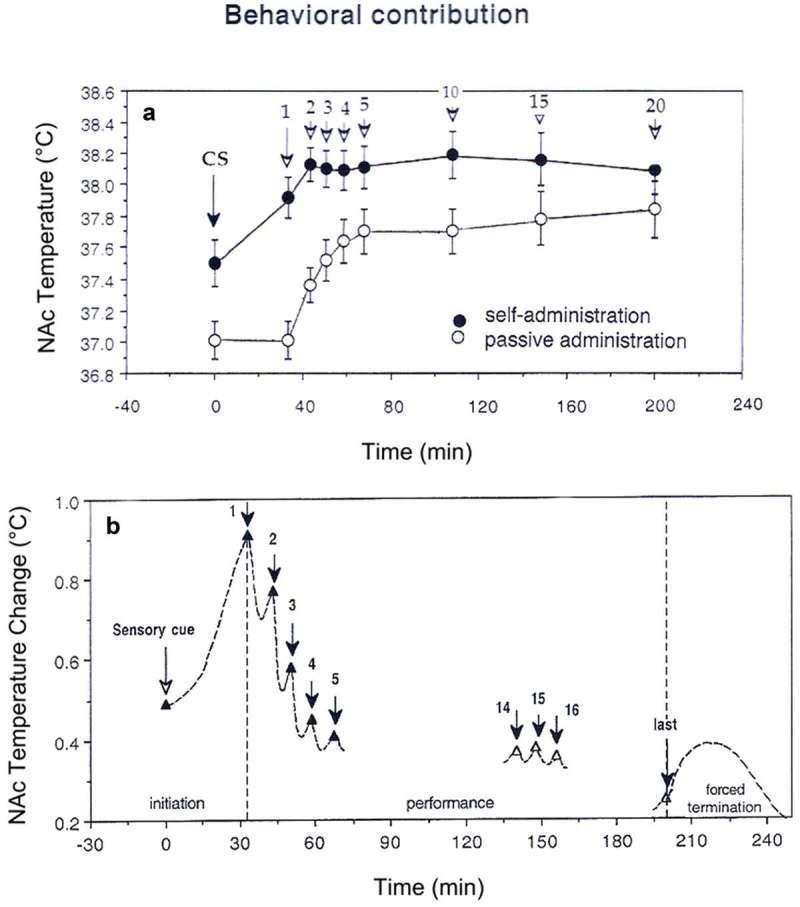
Figure 24.

Behavioral contribution to NAc temperature changes during cocaine self-administration in trained rats. Top graph (A, black symbols) shows mean values of NAc temperature immediately before each critical behavioral event (CS, light+sound conditioned cue, arrows with numbers are consecutive cocaine self-injections. White symbols shown NAc temperature values associated with the same events in yoked-control animals. B shows differences in NAc temperature between active and passive administration of cocaine. Filled triangles show values with significant between-group differences. Picture is based on re-analysis of original data presented in references [223,224].
