
Fig. 1. Assaying mitochondrial morphology in primary neurons.
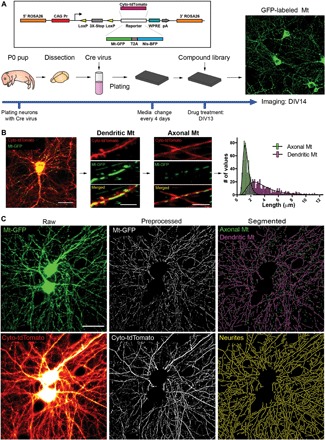
(A) Mt mice, work flow, and timeline of the screen. Mitochondria were visualized in primary mouse neurons by the Cre-dependent expression of mitochondria-targeted GFP (Mt-GFP). The image shows the transduced neurons in the field expressing GFP in somatic and neuritic mitochondria (maximum-projection image of confocal z-stacks, three slices, z = 0.7 μm with a 60× objective). (B) Classification of axonal and dendritic mitochondria. Representative images of a neuron (left) expressing Cyto-tdTomato (red) and Mt-GFP (green) and zoomed-in segments of a dendrite and two axons. The frequency distributions of mitochondrial length, located in either dendrites or axons, are plotted in the right panel. Best-fit lognormal distributions (black lines) show that 15% of the mitochondrial lengths can be found in both axons and dendrites (overlap). naxonal = 517, ndendritic = 525. Scale bars, 25 μm (left image) and 5 μm (middle and right images). (C) Image analysis. Maximum z-projection of the green channel (Mt-GFP) containing mitochondria and wide-field image of neurites (Cyto-tdTomato). After image preprocessing (somatic mitochondria removal from both channels, background subtraction and median filtering of mitochondria, and tubeness filtering of neurites), axonal and dendritic mitochondria and neurites were segmented (axonal, 0.5 to 1.4 μm; dendritic, >2.4 μm) by top-hat filtering followed by adaptive thresholding.