
Fig. 5. MnMs protect from oligomeric Aβ(1–42)–, peroxide-, and glutamate-induced mitochondrial damage in primary neurons.
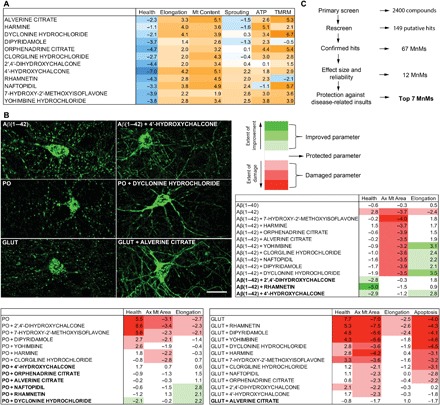
(A) Effects of the selected MnMs. Parameters were measured 24 hours after treatment with 12.5 μM of compounds. Data are mean robust Z-scores from Fig. 4. (B) Effects of selected MnMs in the presence of disease-related insults. Representative images of mitochondrial fragmentation induced by 10 μM Aβ(1–42), 75 μM peroxide (PO), or 25 μM glutamate (GLUT) in Mt-GFP–expressing neurons, and the mitochondrial protection by 12.5 μM of compounds after 48 hours of cotreatment (top left; scale bar, 20 μm). After cotreatment, axonal mitochondrial circularity (health), axonal mitochondrial average area, dendritic mitochondrial length (elongation), and live-dead cell ratio (survival) were either protected (within 2 Z-scores of vehicle-treated control), improved (>2 Z-scores for axonal mitochondrial area, elongation, and survival and <−2 Z-scores for health), or damaged (<−2 Z-scores for axonal mitochondrial area, elongation and survival and > 2 Z-scores for health) compared to the vehicle-treated control (top right and bottom). Compounds fully protective (all parameters are protected or improved) against an insult are bolded. Color bar represents absolute Z-score values toward either improvement (green) or damage (red) of the parameters. Data are mean Z-scores (n = 12 to 18 wells, four fields per well, two independent experiments). (C) Selection of the top seven MnMs. Summary of the steps for the selection of the top seven compounds.