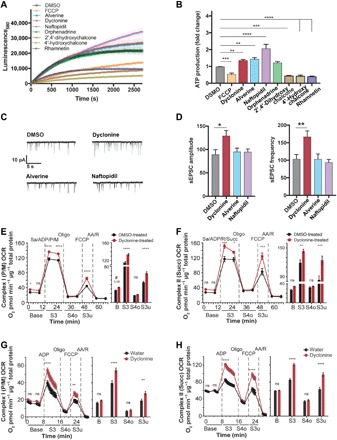
Fig. 6. MnMs enhance ATP production from isolated mitochondria, potentiate basal synaptic activity, and increase respiration of mitochondria in vivo.

(A) Kinetics of ATP production of isolated mitochondria. Baseline-corrected average curves of the ATP production of isolated forebrain mitochondria of newborn C57BL/6J mice starting 20 min after the addition of vehicle (DMSO), 12 μM FCCP, and the top seven MnMs. Data are means ± SD of four runs from one experiment. Single exponential fits yielded amplitudes of 22,498 ± 358 (DMSO, R2 = 0.9), 17,958 ± 216 (FCCP, R2 = 0.98), 28,383 ± 278 (alverine, R2 = 0.96), 28,882 ± 673 (dyclonine, R2 = 0.91), 49,917 ± 838 (naftopidil, R2 = 0.98), 22,764 ± 315 (orphenadrine, R2 = 0.91), 9853 ± 132 (2′,4′-dihydroxychalcone, R2 = 0.92), 6121 ± 99 (4′-hydroxychalcone, R2 = 0.9), and 10,059 ± 166 (rhamnetin, R2 = 0.9). (B) ATP production of isolated mitochondria of the top seven MnMs. Average ATP production of forebrain mitochondria of newborn mice in the presence of DMSO, 12.5 μM FCCP, or 12.5 μM of the top seven MnMs, normalized to average DMSO treatment. Data are means ± SEM of three independent experiments (four runs per experiment) compared to DMSO by one-way analysis of variance (ANOVA) with Dunnett’s post hoc test, **P < 0.01, ***P < 0.001, ****P < 0.0001. (C and D) Synaptic activity of hippocampal neurons. Example traces (C) and quantified sEPSC amplitude/frequency (D) of cultured hippocampal neurons at DIV8 after 24 hours of incubation with DMSO, 12.5 μM dyclonine, alverine, or naftopidil using whole-cell patch-clamping techniques. Data are means ± SEM (n = 33 to 36 cells) compared to DMSO by one-way ANOVA with Dunnett’s post hoc test, *P < 0.05, **P < 0.01. (E and F) Mitochondrial respiration in primary neurons exposed to dyclonine for 24 hours. Before OCR measurements, DIV13 neurons were treated for 24 hours with DMSO (0.1%, black) or dyclonine (10 μM, red). OCRs were measured at baseline respiration (Base) and after addition of mitochondrial substrates pyruvate (P) and malate (M) or succinate (Succ) along with ADP to the permeabilized (saponin, Sa) neurons (first dashed line, S3). Oligomycin addition (second dashed line) blocked proton re-entry through ATP synthase, slowing ETC function to levels necessary to maintain Δψm (S4o; o = oligomycin induced). Addition of FCCP (third dashed line) short-circuited proton influx to bypass ATP synthase, revealing maximal, uncoupled OCR (S3u; u = uncoupler induced). Addition of rotenone (R)/antimycin A (AA), complex I and complex III inhibitors, respectively, were added to block oxidative phosphorylation and measure nonmitochondrial respiration (fourth dashed line). ns, not significant. (G and H) Respiration of isolated mitochondria from dyclonine-treated mice. OCR of whole brain mitochondria of 9-month-old C57BL/6J mice kept on either dyclonine-supplemented (25 mg/kg) or standard water for 7 months was measured in the presence of complex I (G) or complex II (H) substrates preincubated with mitochondria, yielding results similar to those in (E) and (F). Bar graphs [right panels of (E) to (H)] compare the OCR value of the first measured point in each condition between the water- and dyclonine-treated groups (mean ± SEM, n = 11 to 12 wells). Total protein was used to normalize OCR into pmol O2 min−1 μg−1 total protein. Data in (E) to (H) were analyzed using two-way ANOVA with repeated measures. *P < 0.05, **P < 0.01, ***P < 0.001, ****P < 0.0001.
