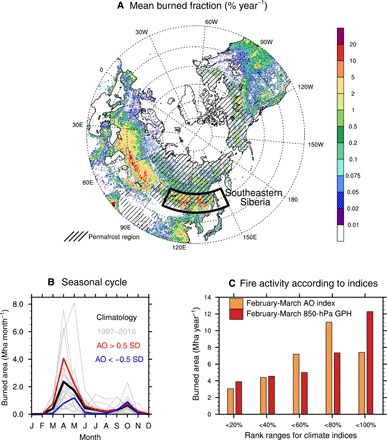
Fig. 1. Fire activity over southeastern Siberia.

(A) Mean burned area fraction (% year−1) over mid- and high latitudes in the Northern Hemisphere. Hatched areas indicate permafrost regions. The black box indicates the study area in southeastern Siberia (100°–150°E, 45°–55°N). (B) Monthly burned area (Mha month−1) in southeastern Siberia for 1997–2016 in each year (gray), mean (thick black), composite for February to March AO index > 0.5 SD cases (red), and AO < −0.5 SD cases (blue). (C) Mean burned area according to February to March AO index (orange) and 850-hPa geopotential height anomaly over southeastern Siberia (red). Bins on the x axis indicate <20%, <40%, <60%, <80%, and <100% rank ranges.
