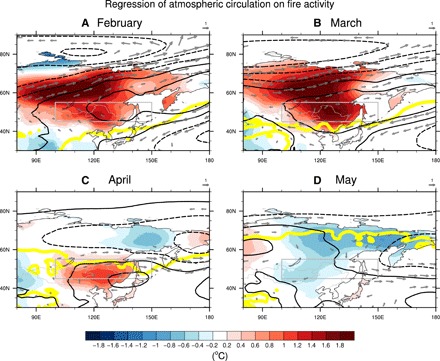
Fig. 2. Atmospheric circulation related to fire activity in southeastern Siberia.

Regression coefficients of temperature (shading), 850-hPa geopotential height (contour; 100-gpm interval), and 850-hPa wind (vector) for February (A), March (B), April (C), and May (D) on normalized yearly burned area in southeastern Siberia (boxed area). The climatological 0°C line for 2-m temperature is shown as a thick yellow line. Wind vectors are displayed only in regions significant at the 95% confidence level based on Student’s t test.
