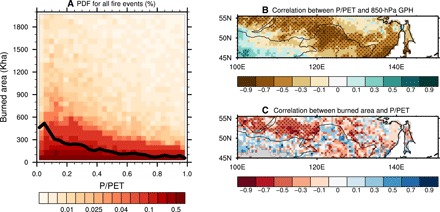
Fig. 4. Fire activity related to aridity.

(A) Probability density function (%) for monthly precipitation to potential evapotranspiration ratio (P/PET) versus monthly regridded burned area (Kha) for each 0.5° × 0.5° grid in southeastern Siberia. The thick black line shows averaged burned area (Kha) in each P/PET bin. (B) Correlation coefficient map for averaged January to May P/PET with February to March 850-hPa geopotential height anomalies over southeastern Siberia. (C) Correlation coefficient map for total annual local burned area with January to May P/PET in each grid cell. Dotted area indicates significant region at the 90% confidence level based on Student’s t test.
