
Fig. 3. Single-molecule visualization of DNA-PK on DNA.
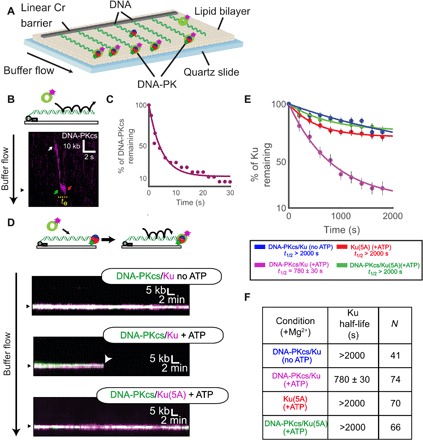
(A) Schematic of the DNA curtains assay for DNA-PK. (B) Illustration and kymograph (time series of one molecule over the course of the reaction) of DNA-PKcs injection onto DNA curtains. White arrow indicates a single DNA-PKcs binding event. This molecule then slides along the DNA in the direction of buffer flow to reach the DNA end (green arrow). The molecule then associates for a short time at the end (te) before dissociation (red arrow). (C) Lifetime of DNA-PKcs on DNA curtains in the presence of ATP. (D) Illustration and kymographs of DNA-PKcs colocalizing with an end-bound Ku and Ku(5A) in the presence or absence of ATP as indicated. (E and F) Lifetime of Ku (WT or 5A) on DNA curtains in the presence or absence of DNA-PKcs or ATP as indicated. Table shows half-life of Ku(WT) or Ku(5A) under various conditions and the number of molecules observed (N).