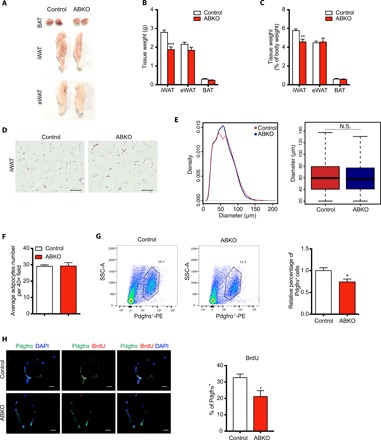
Fig. 5. Ablation of β-catenin in mature adipocyte reduces preadipocyte proliferation and subcutaneous fat mass in long-term HFD feeding.

(A) Representative images of BAT, iWAT, and eWAT depots in 26-week HFD-fed control and ABKO mice. (B and C) Absolute tissue weight (B) and percentage of tissue weight to body weight (C) for iWAT, eWAT, and BAT depot in 26-week HFD-fed control and ABKO mice (n = 13 for each group). (D) Representative images of HE staining of iWAT in 26-week HFD-fed control and ABKO mice. Scale bars, 100 μm. (E) Left: The frequency distribution of adipocyte cell size in iWAT of 26-week HFD-fed control and ABKO mice. Right: Box plot of adipocyte diameter in two groups, Wilcoxon rank-sum test, boxes represent the interquartile range (IQR) between the first and third quartiles, and the line inside the box represents the median; whiskers represent the lowest or highest values within 1.5 times IQR from the first or third quartiles. (F) Cell counting per field in HE-stained sections under microscopy in iWAT of 26-week HFD-fed control and ABKO mice. (G) Left: Representative cell sorting of Pdgfrα+ cells from iWAT SVF of 26-week HFD-fed control and ABKO mice by FACS. Right: Quantification of the percentage of Pdgfrα+ cells to SVF cells in iWAT (n = 7 for each group). (H) Left: Representative images of Pdgfrα and BrdU staining in BrdU-incorporated iWAT sections of 26-week HFD-fed control and ABKO mice. Scale bars, 10 μm. Right: Quantification of the percentage of Pdgfrα+BrdU+ cells to Pdgfrα+ cells in iWATs (n = 4 for each group). ABKO, Adiponectin-cre; β-cateninflox/flox; HFD, high-fat diet; BAT, brown adipose tissue; iWAT, inguinal white adipose tissue; eWAT, epididymal white adipose tissue; SVF, stromal vascular fraction; SSC-A, side scatter area. Data are shown as means ± SEM. *P < 0.05, **P < 0.01, ***P < 0.001. N.S., not significant.
