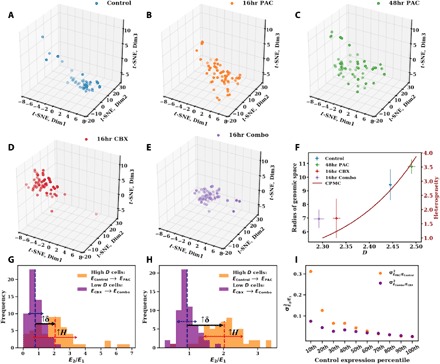
Fig. 4. The scaling of chromatin packing regulates intercellular transcriptional heterogeneity of cancer cells.

(A to E) 3D projections of scRNA-seq data (TPM values of 8275 expressed genes) onto reduced t-SNE space for five conditions: (A) control cells (n = 46), (B) cells treated with 5 nM paclitaxel for 16 hours (16hr PAC; n = 55), (C) 5 nM paclitaxel for 48 hours (48hr PAC; n = 53), (D) 75 μM celecoxib for 16 hours (16hr CBX; n = 62), and (E) combination of 75 μM celecoxib and 5 nM paclitaxel for 16 hours (16hr Combo; n = 59). The size of the cluster indicates the transcriptional heterogeneity within the population of surviving cells for each condition. (F) The radius of genomic space Rc [the radius of clusters from (A) to (E)] increases as a function of the chromatin packing scaling D. D was measured by live-cell PWS at each time point on cells before sequencing. Cells treated with paclitaxel (higher D) have greater transcriptional heterogeneity, especially when compared to cells treated with a nonsteroidal anti-inflammatory agent, celecoxib, which lowers D. Likewise, the CPMC model (red curve, right side, y axis) shows that intercellular transcriptional heterogeneity increases with D. Error bars represent the SE of D calculated from PWS measurements (x axis) and Rc (y axis) for each condition. (G) Relative expression of high D versus low D cells in response to paclitaxel treatment for genes associated with DNA repair pathways, which are up-regulated in 48-hour paclitaxel–treated cells. For each condition (Control, 16hr PAC, 2hr CBX, and 16hr Combo), TPM values of these genes (48 in total) were averaged within each cell. Next, expression of paclitaxel-stimulated cells was normalized by the average of the corresponding unstimulated population. The resulting intercellular distribution of relative expression levels is shown. Dashed lines represent the mean relative expression. Solid red and blue arrows represent the SD of distributions EPAC/EControl and ECBX/ECombo, respectively. For these stress response genes, cells with a higher initial D versus cells with a lower initial D had an increase in transcriptional malleability (↑δ) and a higher intercellular transcriptional heterogeneity (↑ H). (H) Distribution of relative expression of genes, as described in (G), in the lowest percentile (10th percentile) of control expression levels (839 in total). (I) Variance (σ2) of intercellular distribution of relative expression for each percentile of control expression levels. Initially underexpressed genes show an increased effect of chromatin packing scaling on increasing intercellular transcriptional heterogeneity in response to paclitaxel stimulation compared to that of initially overexpressed genes.
