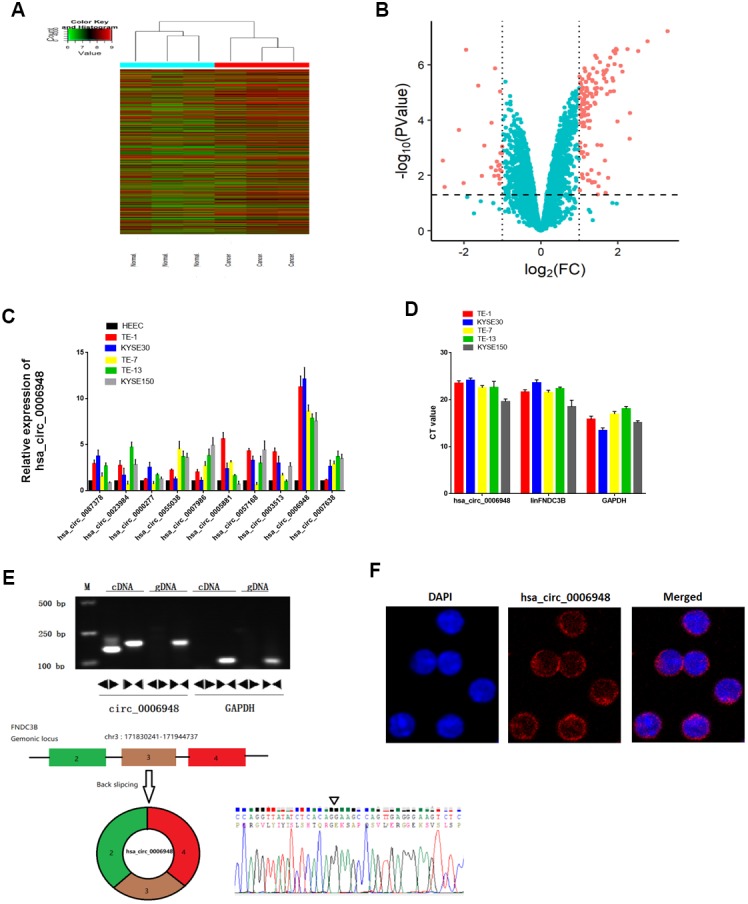
Figure 1.

The identification and characteristics of hsa_circ_0006948 in ESCC cells. (A) Heat map showing the differential expression and hierarchical clustering of circRNAs between ESCC and adjacent normal tissues. (B) Volcano plot, x-axis: log2 (fold change); y-axis: -log10 (P-value). The vertical lines correspond to 2.0-fold up and down, and the horizontal line represents a P-value of 0.05. The red points in the plot represent differentially expressed circRNAs with statistical significance. (C) The relative hsa_circ_0006948 was significantly high in ESCC cells. (D) q RT-PCR analyses of expression of hsa_circ_0006948, linFNDC3B and GAPDH in various ESCC cell lines. Y-axis is the raw CT value. (E) Above: Divergent primers detected circular RNAs in cDNA but not gDNA. Below: Three exons form hsa_circ_0006948 by back splicing from chromosomal region and Sanger sequencing of hsa_circ_0006948 showed the back-splice junction (∇). (F) Fluorescence in situ hybridization assay was conducted to determine the subcellular localization of hsa_circ_0006948.
