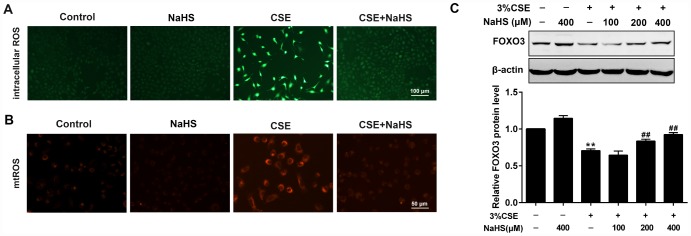
Figure 3.
Effects of NaHS on CSE-induced oxidative stress in A549 cells. A549 cells treated with and without 3% CSE and/or 400μM NaHS for 48 h. Representative microphotographs showing intracellular ROS (A) and mtROS (B) generation respectively. (C) A549 cells were cultured with and without 3% CSE and/or 100, 200, or 400μM NaHS for 48 h. Western blot was used to analyze the protein expression of FOXO3. **P<0.01, significantly different from control cells [3%CSE (-) and NaHS (-)];##P<0.01, significantly different from cells treated with 3%CSE only.

