Figure 8.
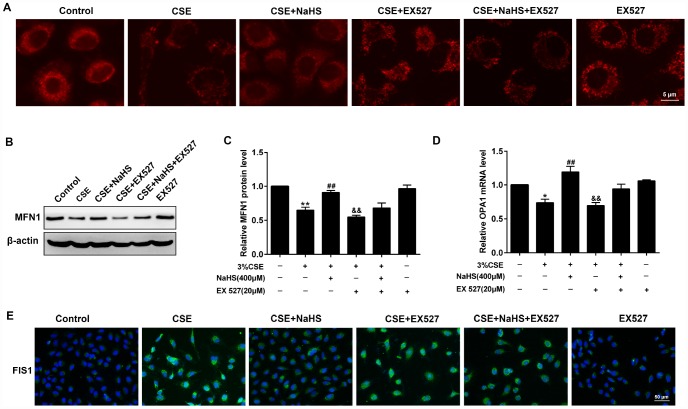
Effects of SIRT1 on the NaHS-mediated the alteration of mitochondrial morphology and mitochondrial dynamics-related protein expression in CSE-stimulated A549 cells. A549 cells were cultured with SIRT1 inhibitor (EX 527) in the absence and presence of 3% CSE and NaHS for 48 h. (A) Representative images for visualization of the mitochondrial morphology in A549 cells. (B, C) Western blot was used to analyze the protein level of MFN1. (D) Real-time PCR was performed to examine the mRNA level of OPA1. (E) Immunofluorescence staining of FIS1 was performed. *P<0.05, **P<0.01, significantly different from control cells [3% CSE (-), NaHS (-) and EX 527 (-)]; ##P<0.01, significantly different from cells treated with 3% CSE only; &&P<0.01, significantly different from cells treated with EX 527 only.

