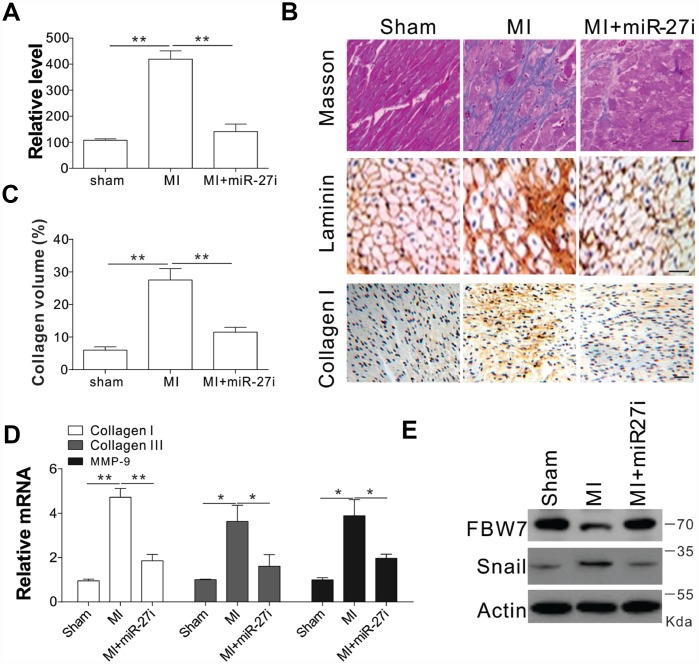
Figure 6.
Antagomir-27b attenuated cardiac fibrosis in rat model of MI (A) Real-time PCR results of miR-27b levels in miR-27i or saline-treated specimens (3 weeks post-injection). (B, C) Analytical results of miR-27i-treated peri-infarct area of rat heart (3 weeks post-treatment). (B) Typical heart sections after treatments of Masson trichrome staining, laminin and collagen I immunostaining. Scale bar, 20 μm. (C) The percentage of tissue area represented the deposition of collagen I, where the automated image analyzer was used for its quantification. (D) Quantitative reverse transcription–PCR results of collagen I, collagen III, and MMP-9 mRNA levels. (E) FBW7 and Snail expression in rat heart. Data were represented as mean ± SEM (n=6). *, p<0.05; **, p<0.01.

