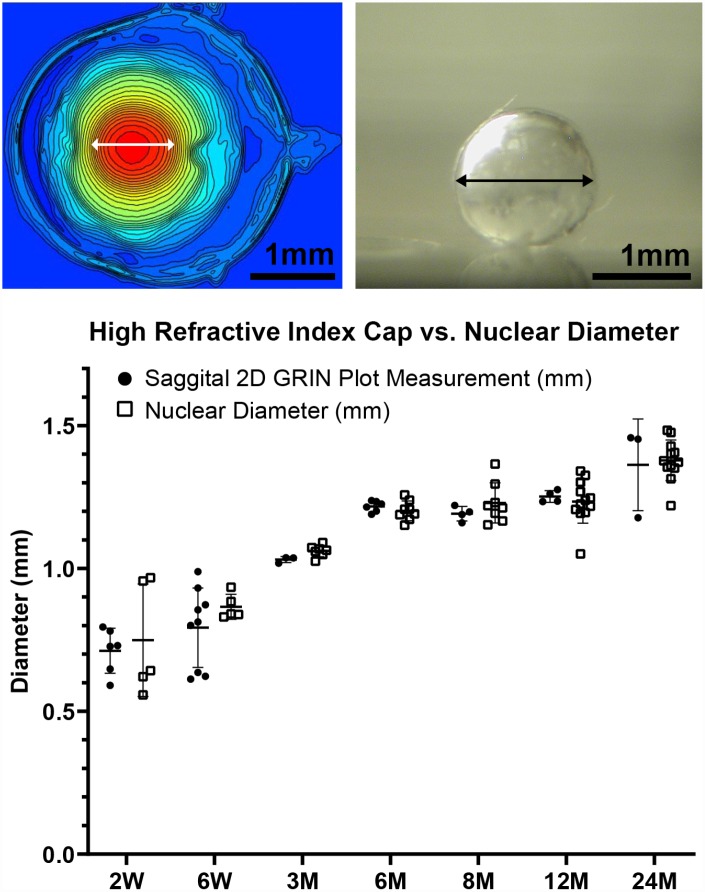
Figure 12.
A comparison of the diameter of the cap region of high refractive index and the diameter of the extracted lens nucleus. The images show a representative mid-sagittal 2D contour plot and a representative lens nucleus with double-headed arrows indicating measured diameters. The graph compares the cap diameter in the sagittal 2D GRIN plot to the diameter of the lens nucleus. Lines on the plots reflect mean ± SD of n = at least 3 lenses from different mice per age. There was no statistically significant difference between the cap and nucleus diameters indicating that the area of high refractive index is directly correlated with the hard and compact lens nucleus. Scale bars, 1mm.

