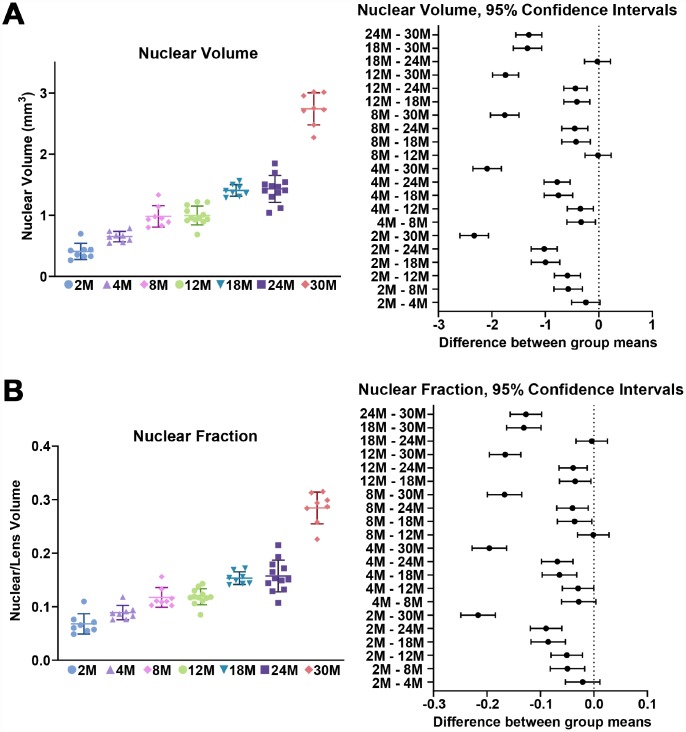
Figure 3.
Nuclear volume and fraction for mouse lenses between 2–30 months of age. Lines on the plots reflect mean ± SD of n = at least 8 lenses per age. The graph next to the data plots shows the 95% confidence interval. Any comparisons not crossing the dotted line are statistically significant (p < 0.05). (A) The volume (mm3) of the lens nucleus steadily increases with age. (B) Since nuclear volume increases more than lens volume with age, the nuclear fraction (nuclear/lens volume) increases with age.

