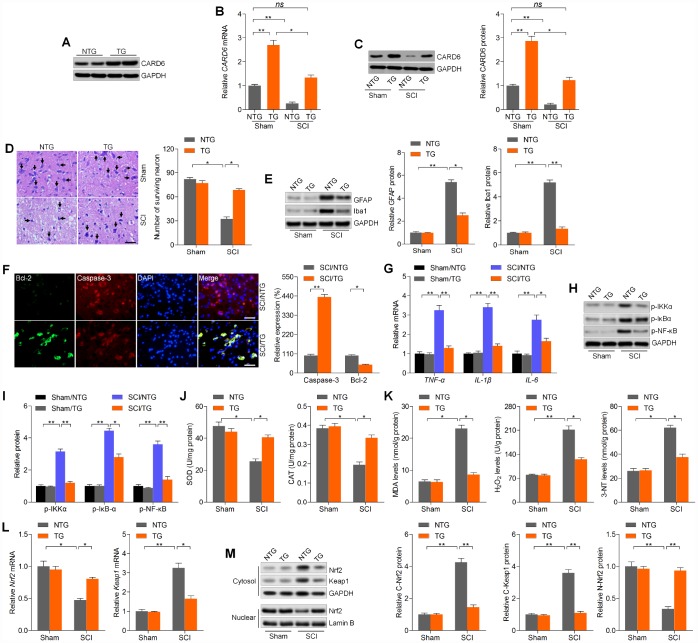
Figure 8.
CARD6 up-regulation alleviates SCI in mice. (A) Western blot analysis of CARD6 protein expression in lumbar spinal tissues from CARD6-NTG or CARD6-TG mice. (B) RT-qPCR and (C) western blot analysis of CARD6 expression levels in lumbar spinal tissues from CARD6-NTG or CARD6-TG mice with or without SCI. (D) Nissl staining of lumbar spinal cords in the ventral horn of gray matter from mice 3 days after SCI. The number of survived neuron was quantified. Scale bar: 100 μm (black arrows: the normal surviving neurons). (E) Western blot analysis was used to calculate GFAP and Iba-1 protein expression levels in the lumbar spinal cord segments. (F) Representative images of Caspase-3 and Bcl-2 double staining by IF in dorsal horn of mice. The relative expression of Caspase-3 and Bcl-2 was quantified. Scale bar: 100 μm. (G) RT-qPCR analysis of TNF-α, IL-1β and IL-6 mRNA levels in the lumbar spinal cord segments. (H, I) Western blot analysis of p-IKKα, p-IκBαand p-NF-κB protein expression levels in the lumbar spinal cord segments. Measurements of (J) SOD, CAT, (K) MDA, H2O2 and 3-NT in spinal cords of mice at 3 days after SCI. (L) RT-qPCR analysis of Nrf2 and Keap1 mRNA expression levels in the lumbar spinal cord segments. (M) Western blot analysis for cytosolic Nrf2 and Keap1, and nuclear Nrf2 protein expression levels in the lumbar spinal cord segments. Data represented means ± SEM (n=8 each group). *p < 0.05 and **p < 0.01; ns, no significant difference.

