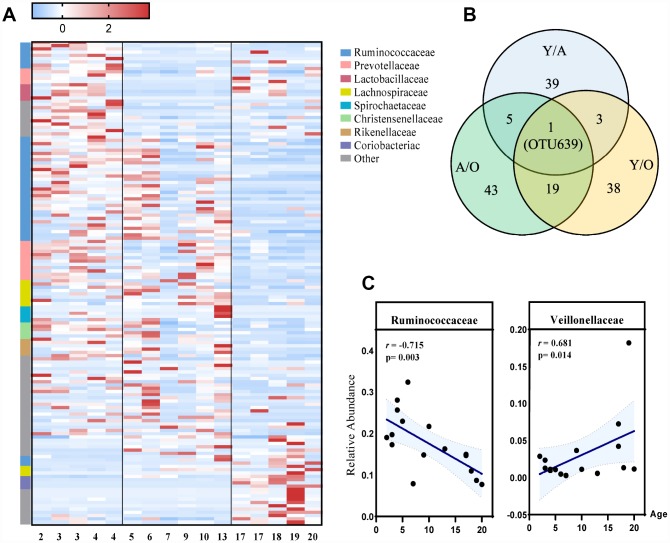
Figure 3.
The most differentially expressed taxa among the three groups. (A) Heatmap of the 148 discriminative OTU abundances among the young, adult and old groups (LDA>2.0). OTUs (raw) were sorted by taxa and enriched groups, samples (column) were sorted by age. The intensity of color (blue to red) indicated the score normalized abundance for each OTU. (B) Venn diagram for different OTUs among the three groups. Blue designates enriched taxa between the young and adult groups; green designates enriched taxa between the adult and old groups; yellow designates the enriched taxa between the young and old groups. (C) Scatter diagram of the relative abundances of the age-related microbial families Ruminococcaceae and Veillonellaceae. The correlation was tested by Pearson’s correlation analysis and was adjusted by partial correlation analysis.

