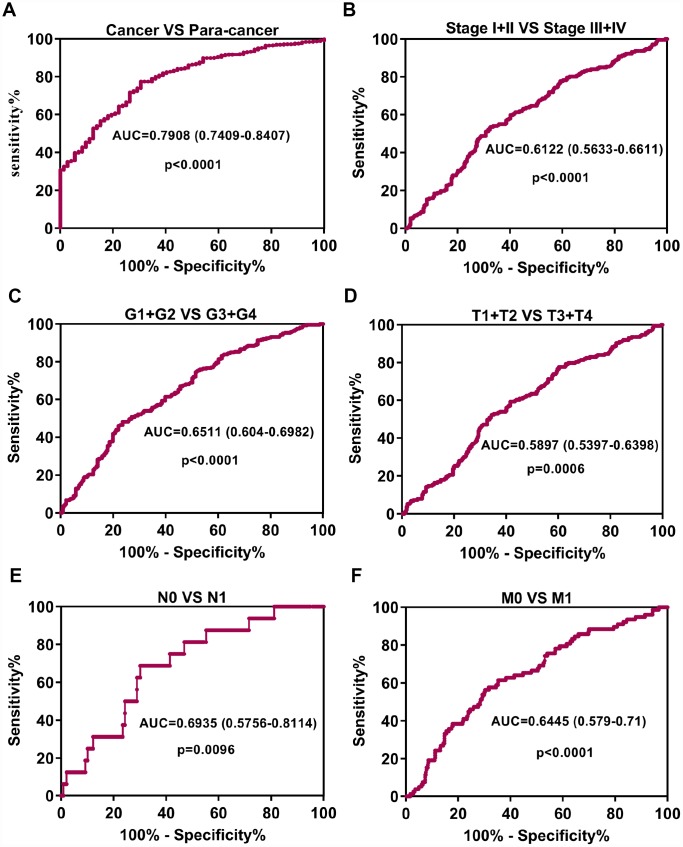
Figure 3.
Up-regulation of GPX1 may serve as a potential diagnostic biomarker in ccRCC. (A) ROC curve analysis indicated that GPX1 could efficiently distinguish ccRCC from normal individual. The area under curve (AUC) was 0.7908 (p<0.0001). ROC curve analysis towards the expression levels of GPX1 mRNA in ccRCC subgroups against pathological stage (B), G stage (C), T stage (D), N stage (E) and M stage (F).

