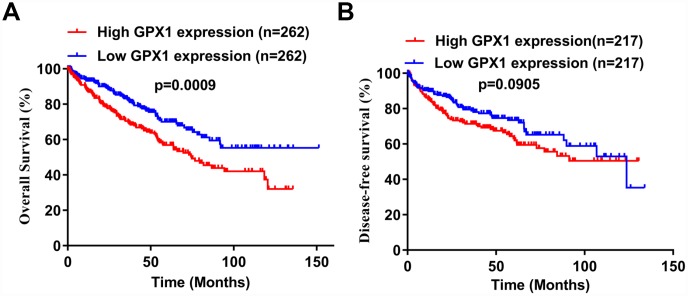
Figure 4.
Potential prognostic value of high GPX1 expression in ccRCC patients. (A–B) Based on the median value of GPX1 expression, ccRCC samples from the TCGA database were divided into high GPX1 expression group and low GPX1 expression group. Kaplan-Meier curves were used to analyze the correlation between GPX1 levels and overall survival time (OS) and disease-free survival time (DFS) in ccRCC samples.

