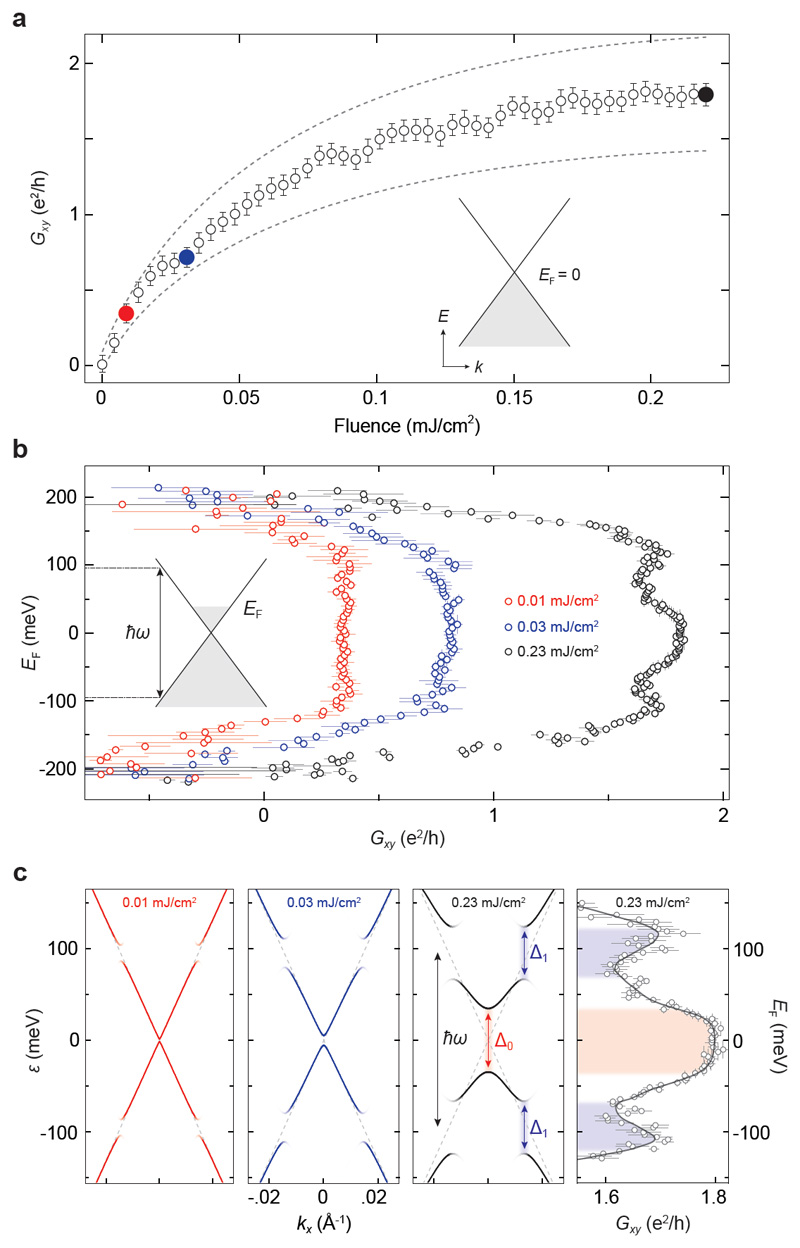
Fig. 4. Evidence for topological Floquet bands.
a, Non-equilibrium anomalous Hall conductance Gxy as a function of the peak laser drive pulse fluence. The equilibrium Fermi level was gated to the Dirac point (EF = 0). Error bars are the standard statistical error, and the dashed lines denote the systematic error from the calibration of the photoconductive switch. Colored data points correspond to the fluences measured in b. b, Gxy as a function of the equilibrium EF measured at three fluences. Horizontal error bars are the standard error and vertical error bars denote the uncertainty related to determining the precise value of the Dirac point. The systematic error on Gxy is the same as in (a). c, Left three panels: Effective band structures for the fluences reported in (b) simulated using Floquet theory. At the highest fluence, we calculated Δ0 ≈ 69 meV and Δ1 ≈ 56 meV. Right panel: Blow up of the high-fluence data in (b) for comparison. Solid line is the smoothed data. Shaded regions highlight the features corresponding to light-induced band gaps in the Floquet band structure.

