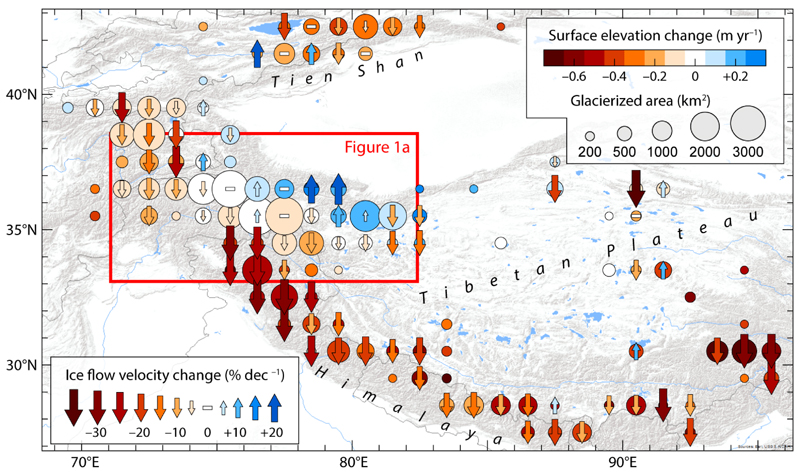
Figure 2. Recent glacier changes in High Mountain Asia.
The rate of glacier surface elevation change28 is shown together with changes in ice flow velocity15 for the period 2000-2016. The size of the circles is proportional to the glacier area. Data are aggregated on a 1° × 1° grid, and uncertainties are shown in Supplementary Figure S1. The red box indicates the area shown in Figure 1a and includes the Karakoram.

