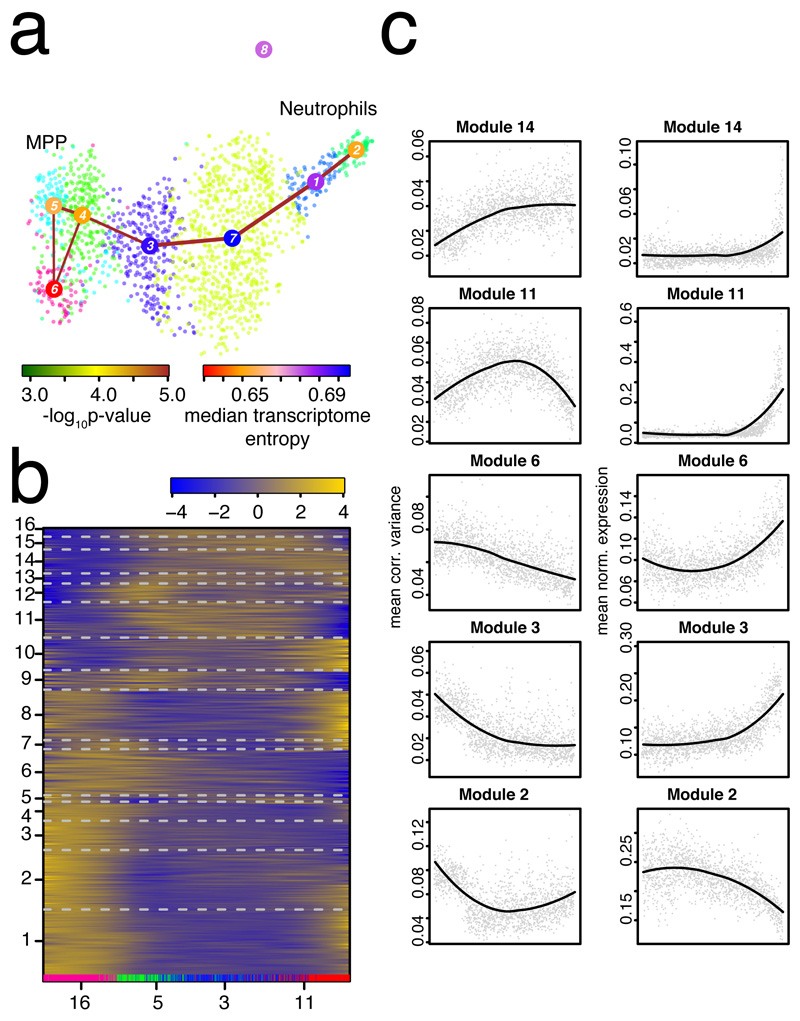
Figure 3. Exploring dynamics of gene expression variability during neutrophil differentiation.
a, Separate RaceID3/StemID28 analysis all cells from the original clusters 16, 5, 3, and 11. The link color indicates the link p-value and the vertex color represents transcriptome entropy. The link p-value and transcriptome entropies were derived by StemID28. b, Self-organizing map (SOM) of pseudo-temporal corrected variability profiles inferred by FateID8 using the variability matrix as input. The color indicates the z-score of loess-smoothed profiles. Cells were ordered along the trajectory connecting clusters 5, 4, 3, 7, 1, and 2 in (a) by StemID2. Original clusters (cf. Fig. 1b) are highlighted at the bottom. Modules were obtained by grouping SOM nodes based on correlation of averaged profiles (Pearson correlation > 0.85). Only modules with >10 genes are shown in the map. Genes with >2 transcripts in at least one cell were included. c, Pseudo-temporal variability (left) and corresponding gene expression (right) profiles averaged across all genes in a module. Pseudo-temporal profiles were normalized to the same scale by dividing transcript counts and corrected variabilities by the sum across all cells on the trajectory. (a-c) Data from n=2 biologically independent experiments.

