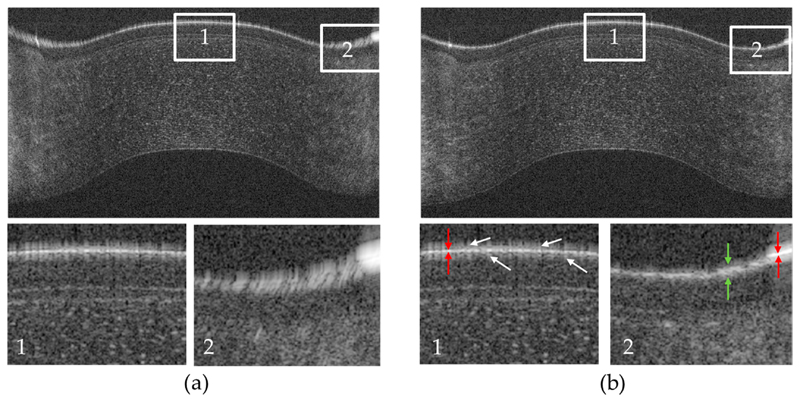
Figure 2.
Representative B-scan of the cornea recorded with the instrument in the co-polarized detection channel. (a) Without variable dispersion compensation (fixed parameter over the entire B-scan) dispersion is clearly visible at the periphery of the cornea; (b) B-scan evaluated with variable dispersion compensation. The lower row shows magnified views (3×) of the regions of interest (1,2) that are marked with white rectangles in the upper row. White arrows point to artefacts at the corneal surface. Red arrows indicate the axial point spread function. Green arrows indicate a thickening of the topmost layer of the epithelium. The field of view of the large images is 11 mm (x) and 867 μm (z).

