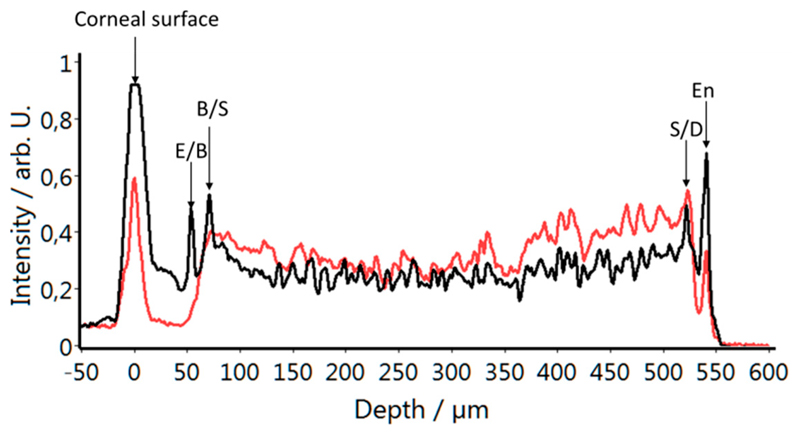
Figure 4.
Averaged depth profiles of the central 100 A-scans of the images displayed in Figure 3. Black indicates the co-polarized, red the cross-polarized detection channel. The arrows point to the different corneal interfaces. E (epithelium), B (Bowman’s layer), S (stroma), D (Descemet’s membrane), En (endothelium).

