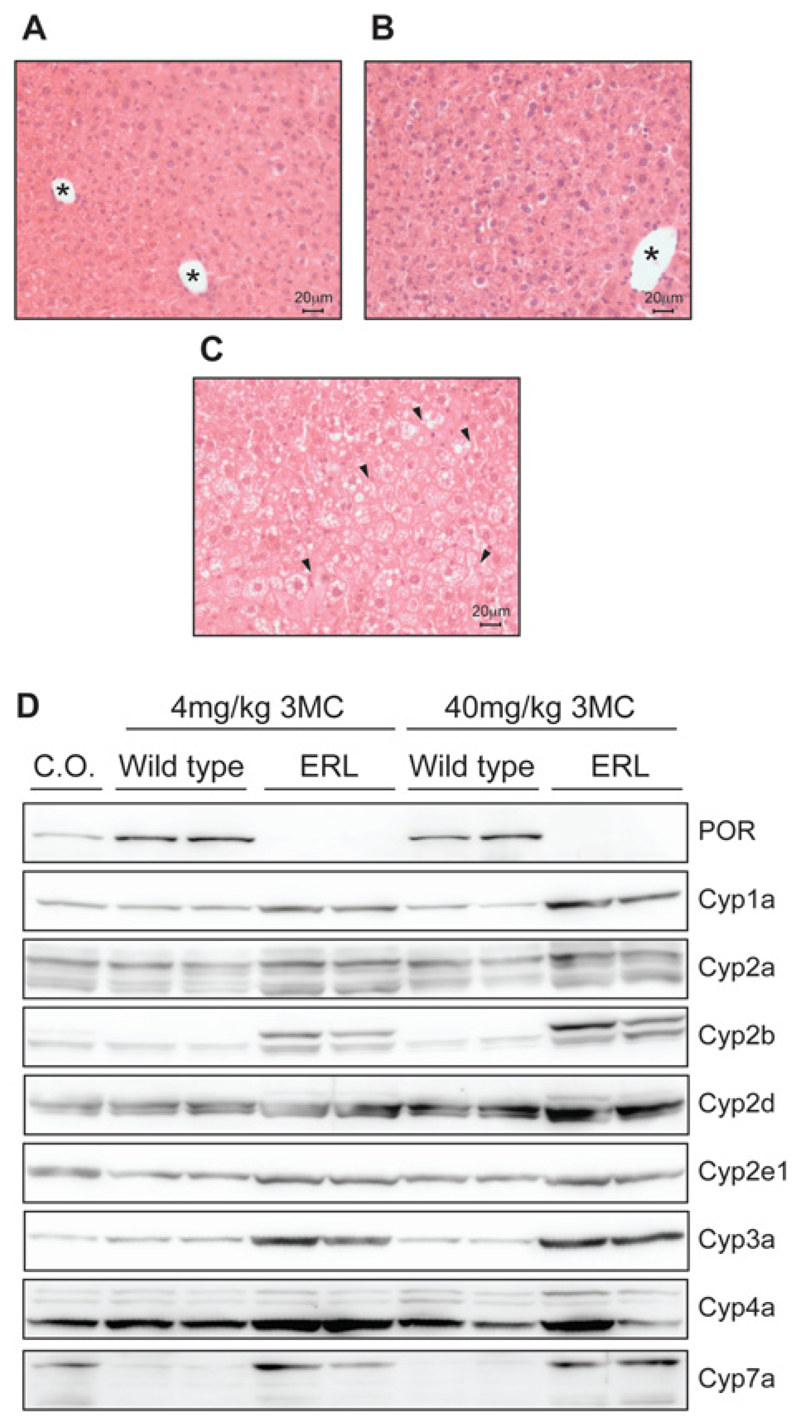
Figure 5. Histopathology and P450 expression in the livers of WT (Porlox/lox) and ERL (Porlox/lox/CreCyp1a1 − KI) mice.
Haematoxylin and eosin staining of liver sections from: (A) ERL (Porlox/lox/CreCyp1a1 − KI) treated with corn oil; (B) WT (Porlox/lox treated with 3MC (4 mg/kg); (C) ERL (Porlox/lox/CreCyp1a1 − KI) treated with 3MC (4 mg/kg). Arrowheads indicate vacuoles created by fat deposits; * designate blood vessels. (D) Western blot analysis of cytochrome P450 expression in the livers of WT (Porlox/lox) and ERL (Porlox/lox::CreCyp1a1 − KI) mice (n = 2) dosed with 3MC (4 or 40 mg/kg i.p.). WT mice treated with corn oil (C.O.) only were used as vehicle control.

