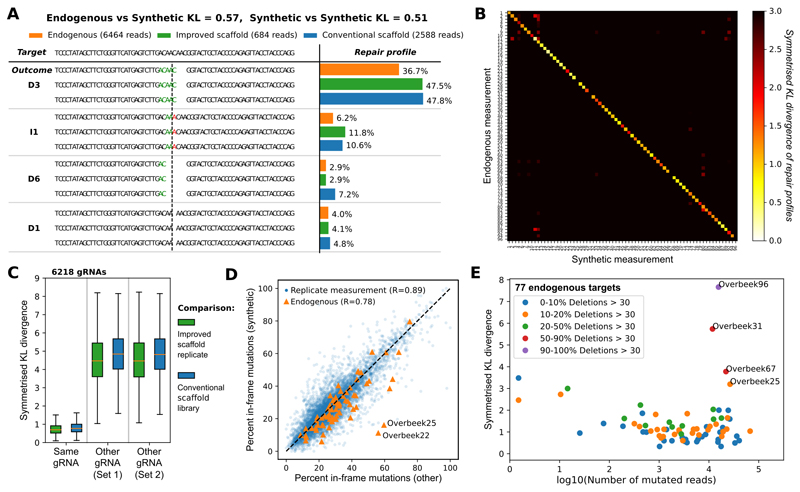
Figure 2. Synthetic mutational profiles are reproducible, specific to individual gRNAs and closely resemble endogenously measured profiles in human K562 cells.
A. Example of measured repair profile reproducibility for one gRNA-target pair. DNA sequence of the target (top) is edited to produce a range of synthetic outcomes that employ the improved gRNA scaffold (green bars) and conventional gRNA scaffold (blue bars), contrasted to endogenous measurements (orange bars). The proportions (x-axis) of the four most frequent mutational outcomes (e.g. “D3” - deletion of three base pairs depicted, “I1” - insertion of a single “A” at cut site, etc.; y-axis) is consistent between the experiments. Stretches of microhomology (green) and inserted sequences (red) are highlighted at the cut site (dashed vertical line).
B. Synthetic measurements faithfully capture endogenous outcomes. Symmetrized Kullback-Leibler divergence (white to black color scale) between synthetic repair profile measurements in K562 cells (x-axis) and endogenous repair profiles from van Overbeek et al. (y-axis; at least 100 reads in our synthetic samples).
C. Synthetic measurements are reproducible and gRNA-specific, irrespective of gRNA scaffold used. Box plots (orange median line, quartiles for box edges, 95% whiskers) of symmetrised KL divergences between two measurements of the same target (left), or between measurements of randomly selected target pairs from the same set (middle, right). Green boxes: comparison of biological replicates of the same library using the improved scaffold; blue boxes: comparison of matched measurements between libraries employing the conventional scaffold, and the improved scaffold; median mutated read numbers per gRNA in parentheses. The 6,218 gRNAs used are from the “Conventional Scaffold gRNA-Targets” set (Online Methods); improved scaffold is used throughout the rest of the paper.
D. Frame information is reproducible between replicates, and well correlated with endogenous outcomes. Blue markers: Percentage of in-frame outcomes in our synthetic measurements (y-axis) contrasted against another biological replicate (x-axis; Pearson’s R=0.89, gRNAs as in C, improved scaffold only). Orange markers: same, but contrasting information from combined synthetic replicates (y-axis) against 68 endogenous measurements (x-axis; Pearson’s R=0.78, gRNAs as in B, excluding four with majority of large deletions not captured in our assay).
E. Low coverage and large deletions are the main sources of discrepancy between endogenous and synthetic measurements. Symmetrized KL divergence (y-axis) between endogenous and synthetic measurements of editing outcomes (individual markers; gRNAs as in B) is dependent on the sequencing coverage (log10(number of obtained reads), x-axis), and frequency of very large deletions (colors). Three target sequences that frequently give rise to very large deletions (red, purple) are not well captured by our assay design.

