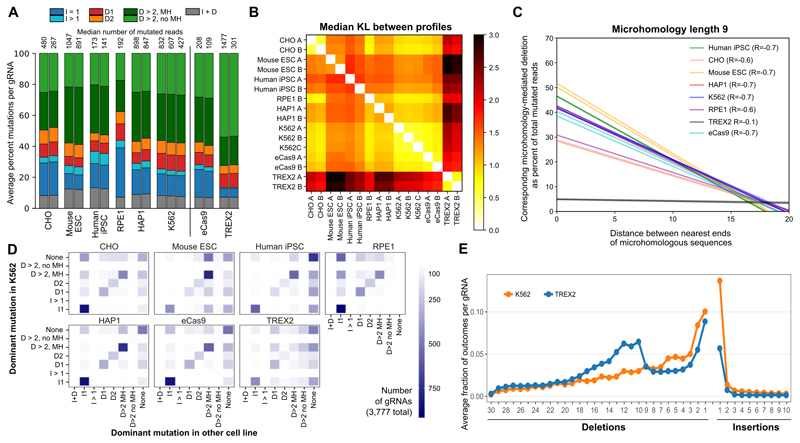
Figure 5. Differences between editing outcomes in K562-Cas9 and other cell lines and effector proteins.
A. Genetic background influences editing outcomes. Average per-gRNA frequency of different types of editing outcomes in 3,777 gRNAs (y-axis; colors as 3B) for Chinese hamster ovary cell line (CHO), mouse embryonic stem cells (Mouse ESC), human induced pluripotent stem cells (iPSCs), human retinal pigmented epithelial cells (RPE-1), human near-haploid cell line (HAP1), K562 cell line, and K562 cells with alternative Cas9 proteins: enhanced Cas9 (eCas9), and Cas9-TREX2 fusion (TREX2). Separate vertical bars are measurements from biological replicates; median number of mutated reads per gRNA is given above the bar for each replicate.
B. Mutational outcomes are similar across cell lines, with consistent moderate differences in stem cells and the K562 Cas9-TREX2 fusion line. Median symmetric Kullback Leibler divergence between repair profiles (black to white color range, as in Figure 2B) in different tested lines (x and y axis). gRNAs as in A.
C. Microhomology-mediated repair fidelity is similar across genetic backgrounds, but differs for Cas9-TREX2 fusion. Regression lines (as in Fig 4A) for fraction of mutated reads (y-axis) for increasing distance between matching sequences of length 9 (x-axis) in K562 cells (blue) and other tested lines (colors) in multiple replicates (individual lines), with overall Pearson’s correlation denoted in the legend. gRNAs as in Figure 4B, restricted to those 822 gRNAs with MH of length 9 and at least 20 mutated reads in all samples.
D. The type of the dominant outcome per gRNA is consistent across cell lines overall, but biased towards microhomology-mediated deletions in stem cells, and I1 insertions in RPE-1 and CHO. The number of gRNAs (color) for which the most frequent indel comes from each class (x-axis) in the other cell lines examined (panels) compared to that for the same gRNA in K562 (y-axis). “None” refers to gRNAs without any indel consistently most frequent in all replicates. gRNAs as in A. RPE data is based on one replicate, K562 on three, all other cell lines on two replicates.
E. Cas9-TREX2 fusion protein favours larger deletions compared to K562. Deletions of increasing size (x-axis) become more frequent (y-axis) in K562 Cas9-TREX2 cells (blue) compared to standard K562 Cas9 (orange). gRNAs as in A.

