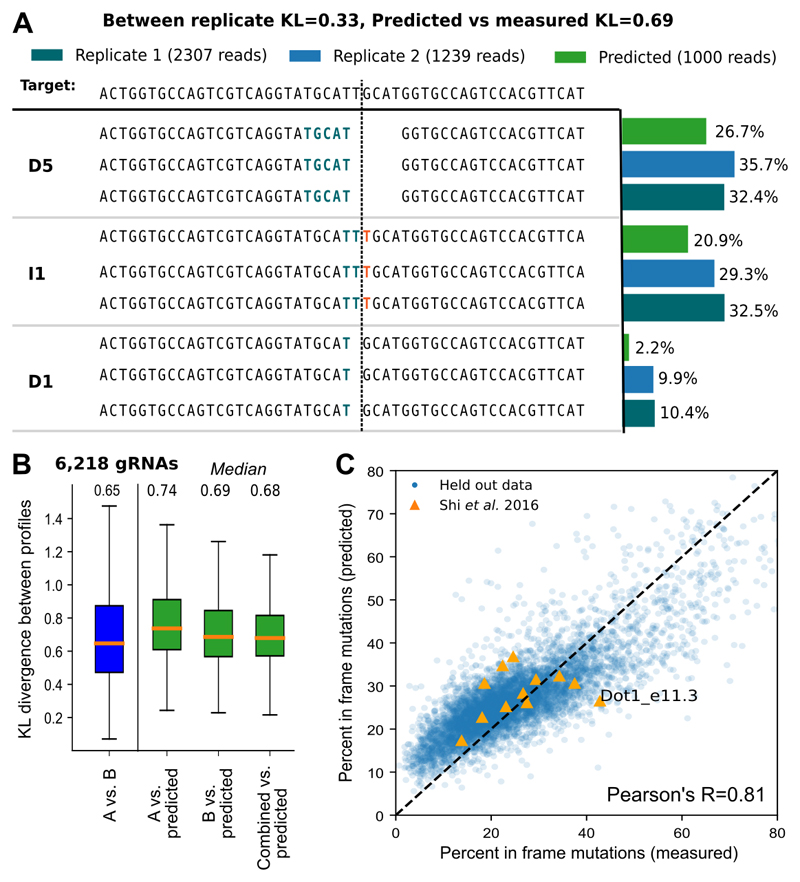
Figure 6. Accurate prediction of repair profiles.
A. Example of a repair profile prediction with accuracy close to the test set median (KL=0.69). DNA sequence of the target (top) is edited to produce a range of outcomes in two synthetic replicates (dark green, blue bars) and the corresponding predicted outcomes (green bars). The proportions (x-axis) of the three largest mutational outcomes (“D5” - deletion of size 5 with highlighted size 5 microhomology, “I1” - insertion of a guanine at the cut site, “D1” - deletion of PAM-distal cytosine at the cut site; y-axis) is consistent between the biological replicates and the prediction. Stretches of microhomology (green) and inserted sequences (red) are highlighted at the cut site (dashed vertical line).
B. Repair profiles can be predicted from sequence alone. Symmetrised Kullback-Leibler divergence (KL, y-axis) between predicted and actual repair profiles (green), as well as between biological replicates A and B (blue; x-axis), with median values denoted above. Box plots: median line with median value marked, quartile box, 95% whiskers. 6,218 gRNAs as in Figure 2C; these were not used in training or hyperparameter selection.
C. Frameshift mutations can be predicted with high accuracy. Measured (x-axis) and predicted (y-axis) percent of mutations that do not produce frameshift mutations for 6,218 held-out gRNAs as in B (blue), and 12 gRNAs that were deep sequenced in (Shi et al. 2015) (orange). Dot1_e11.3 has over 90% deletions of size greater than 30 in the Shi et al sequencing data so we do not expect accurate predictions for this gRNA.

