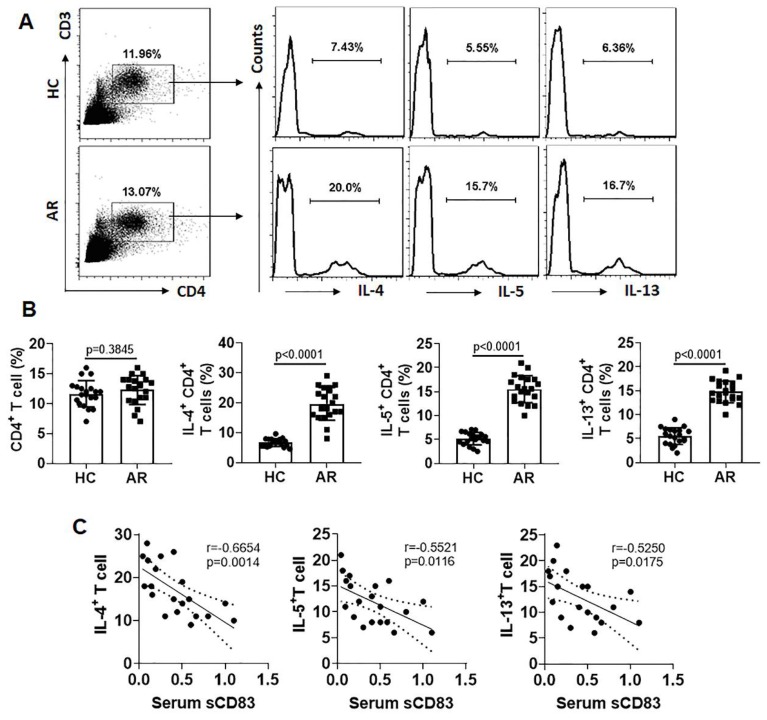
Figure 2.
Serum sCD83 levels are negatively correlated with Th2 polarization in AR patients. Blood samples were collected from 20 HC subjects and 20 AR patients. Peripheral blood mononuclear cells (PBMC) were isolated and analyzed by flow cytometry. (A) Gated dot plots show frequency of CD3+ CD4+ T cells. Gated histograms show frequency of Th2 cells. (B) summarized data of panel A. (C) correlation between serum sCD83 (data are presented in Fig.1) and Th2 cells. Data of bars are presented as mean ± SEM. Each dot in bars present data obtained from one patient. Statistics: t test (B) or Pearson correlation assay (C).

