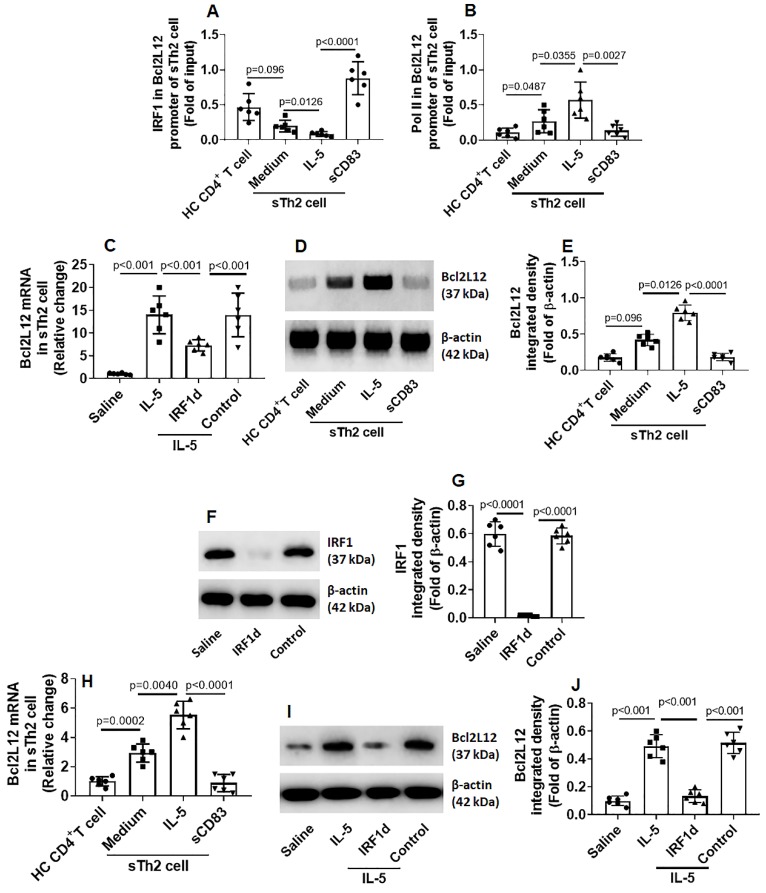
Figure 6.
IRF1 represses Bcl2L12 expression in sTh2 cells. (A-D) sTh2 cells were isolated from blood samples from AR patients; naïve CD4+ T cells were collected from HC subjects. The cells were treated with procedures denoted on the x axis of panel A. Bars indicate levels of IRF1 (A) and Pol II (B) in the Bcl2L12 promoter (by ChIP). Bars indicate Bcl2L12 mRNA levels (C). Immunoblots indicate Bcl2L12 protein (D). (E) Immunoblot image analysis data of panel D. (F) Results of IRF1 CRISPR in sTh2 cells. IRF1d: IRF1-deficiency. (G) Immunoblot image analysis data of panel F. (H-J) sTh2 cells were treated with the procedures denoted on the x axis of panel H. Bars show Bcl2L12 mRNA levels (H). Immunoblots show Bcl2L12 protein levels (I). Immunoblot image analysis data of panel I (J). Statistics: ANOVA + Bonferroni test.

