
Fig. 1.
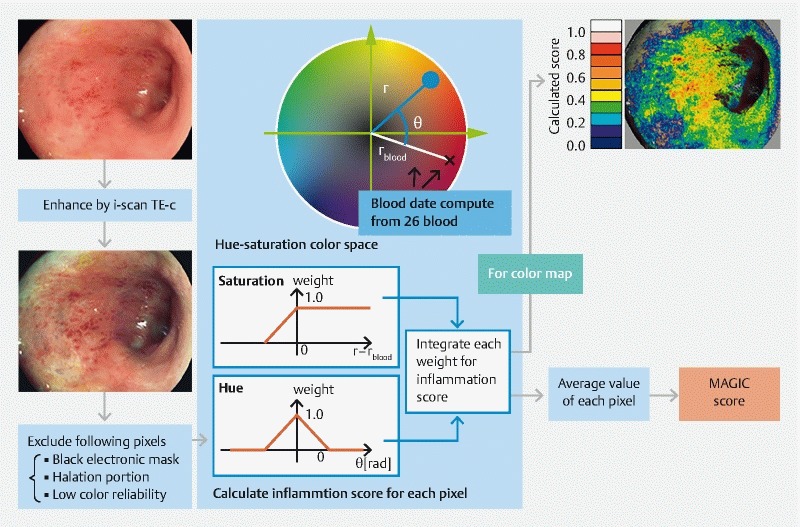
The level of inflammation was calculated with a weighting function from the differences between references after excluding the low-reliability pixels in the TE-c enhanced image. Coloring each pixel according to the level of inflammation creates a visual image of the MAGIC score as a color map. The MAGIC score was defined as the mean inflammation score of all of the pixels.