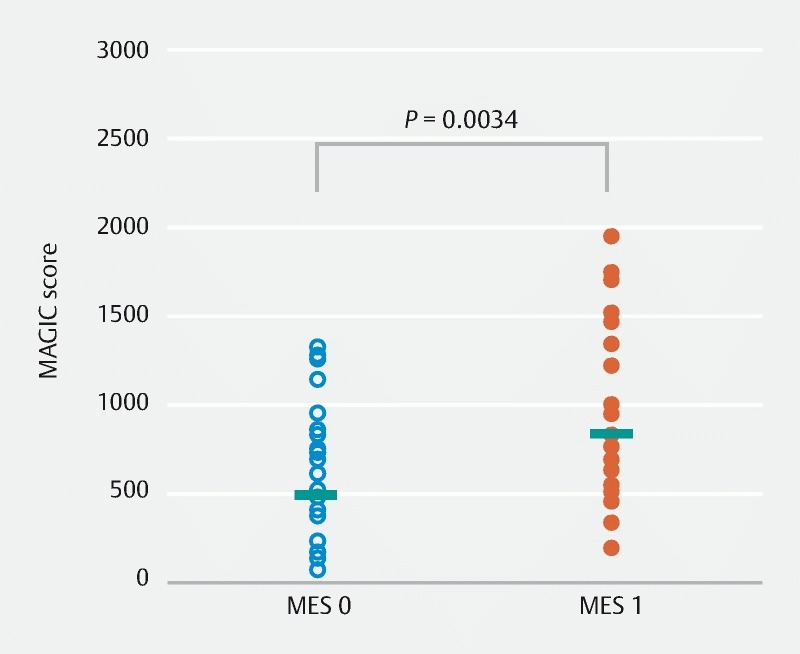
Fig. 2.

Relationship between the MAGIC score and MES 0 or 1. The MAGIC score of the MES 0 group was significantly lower than that of the MES 1 group (MES 0: 487.2 ± 378.2; MES 1: 779.8 ± 488.4, P = 0.0034). Data were analyzed by Mann – Whitney U test.
