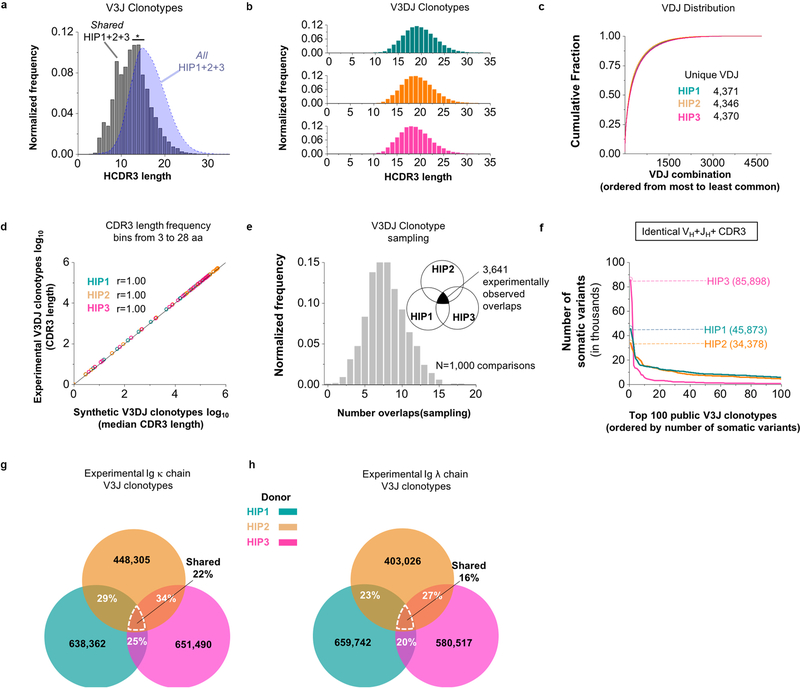
Extended Data Figure 2. Extent of sharing between Ig clonotypes belonging to HIP1–3.
(a) Normalized frequency histogram of HCDR3 sequence lengths belonging to V3J clonotypes from All HIP1+2+3 (blue filled curve, n = 30,156,947 unique CDR3s with a median CDR3 length of 16 amino acids) and Shared HIP1+2+3 (grey bins, n = 22,934 unique CDR3s with a median CDR3 length of 13 aa). The medians were statistically different based on a two-tailed Mann-Whitney U test with a P < 2.2×10⁻¹⁶ (at an α = 0.05). (b) Normalized frequency histogram of CDR3 lengths belonging to all V3DJ clonotypes from HIP1 (n = 1,750,325 unique CDR3s with a median CDR3 length of 19 aa), HIP2 (n = 3,889,527 unique CDR3s with a median CDR3 length of 19 aa) and HIP3 (n = 1,437,339 unique CDR3s with a median CDR3 length of 19 aa). (c) Cumulative distribution of normalized VDJ triple frequencies used for simulation: HIP1 (n = 4,373 unique VDJ triples), HIP2 (n = 4,351 unique VDJ triples) and HIP3 (n = 4,372 unique VDJ triples). (d) Log-Log frequency plot between experimental and synthetic CDR3 lengths. The Pearson correlation coefficient r = 1.00 with a P < 2.2 × 10⁻¹⁶ (at an α = 0.05) (n = 26 CDR3 length bins for each set). (e) Normalized frequency histogram of V3DJ overlap counts between all three synthetic HIP distributions (n = 3,641 common clonotypes between sequenced repertoires). (f) V3J clonotypes with the largest numbers of somatic variants. Numbers in parenthesis denote counts for the number of unique somatic variants associated with a V3J clonotype for HIP1, HIP2 or HIP3. (g) Percentage overlaps for the Ig κ V3J clonotypes from the experimentally determined repertoires belonging to HIP1–3. (h) Percentage overlaps for Ig λ V3J clonotypes from the experimentally determined repertoires belonging to HIP1–3.

