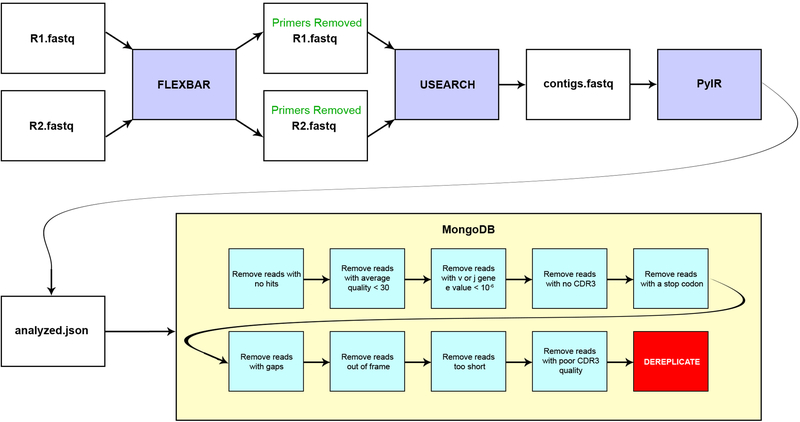
Extended Data Figure 4. Schematic diagram showing bioinformatic sequence processing.
The flowchart shows how a typical sequencing run using paired ends (PE) reads from Illumina was processed using bioinformatics pipeline. Detailed descriptions for each of the programs used in the pipeline can be found in the supplementary methods.

