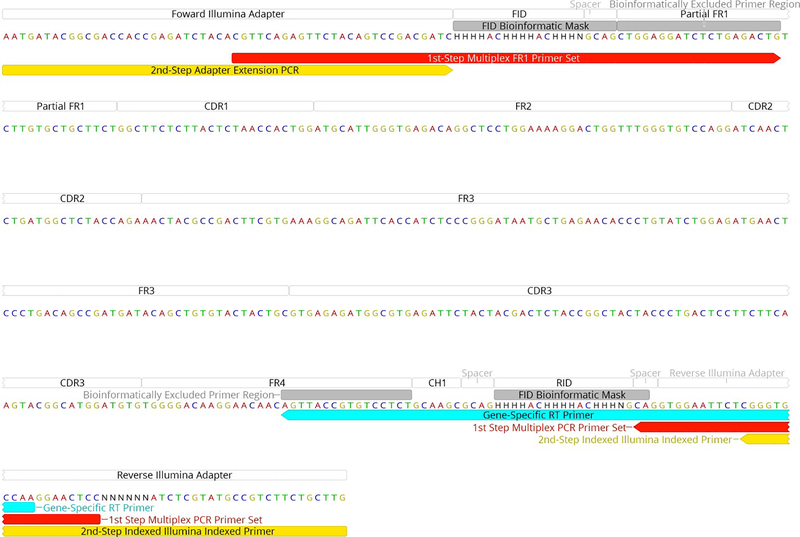
Extended Data Figure 5. Schematic showing placement of primers.
Annotated example of a biological sequence obtained from the two-step barcoded library preparation protocol. The red and yellow regions show the placement of the first and second steps of PCR amplification. The cyan region shows the location of the RID tagged RT gene specific primer.

