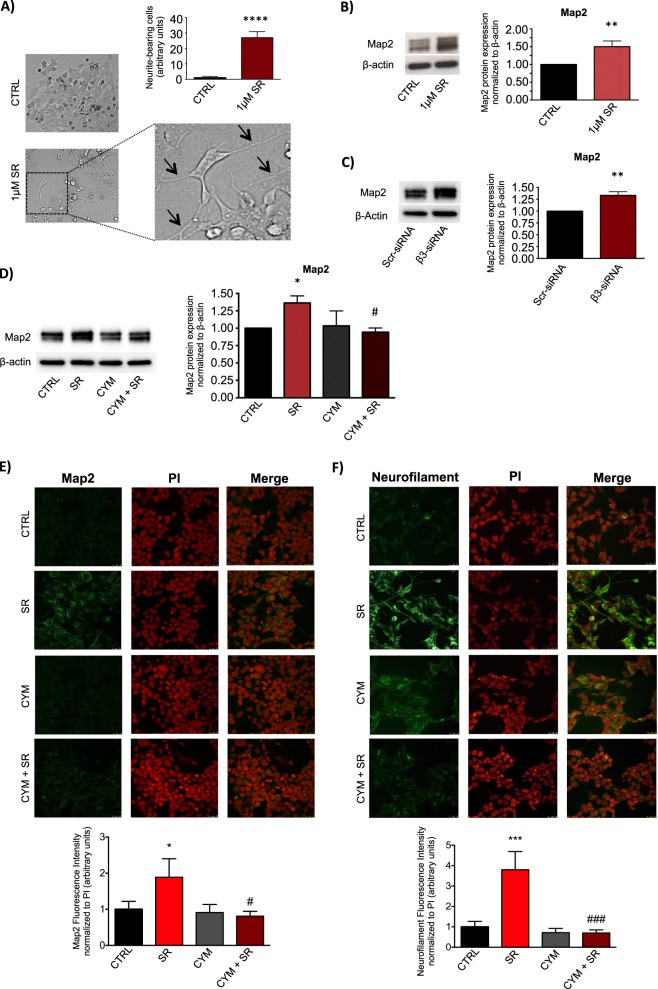
Fig. 4.
β3-AR blockade increases neuronal differentiation of human neuroblastoma BE(2)C cells through the involvement of SK2/S1P2 signaling. a Images showing neurite outgrowth (black arrows) and relative quantification in SR59230A and control condition after 72 h of treatment of BE(2)C cells. To quantify neurite outgrowth, images were acquired from six randomly chosen fields in each well in triplicate for condition, and neurite-bearing cells were counted. Results are reported as mean ± SD of three independent experiments. Significance was calculated by Unpaired t-test analysis with equal SD (****P < 0.0001). b WB and relative densitometric quantification analysis, showing protein levels of the differentiation marker Map2 in BE(2)C cell line treated with 1 μM SR59230A for 48 h. Results were normalized to the expression of β-actin and reported as mean ± SD, fold change over control, set as 1. Blot is representative of three independent experiments. Significance was calculated by Unpaired t-test analysis with equal SD (**P < 0.01). c WB and relative densitometric quantification analysis, showing protein levels of Map2 in BE(2)C cell line transfected with Scrambled (Scr)- and β3-AR-siRNA for 48 h. Results were normalized to the expression of β-actin and reported as mean ± SD, fold change over control, set as 1. Blot is representative of three independent experiments. Significance was calculated by Unpaired t-test analysis with equal SD (**P < 0.01). d WB and relative densitometric quantification analysis, showing protein levels of the differentiation marker Map2 in BE(2)C cell line treated with 1 μM SR59230A for 48 h, in presence or not of 10 μM CYM5520. Results were normalized to the expression of β-actin and reported as mean ± SD, fold change over control, set as 1. Blot is representative of three independent experiments. Significance was calculated by two-way ANOVA analysis followed by Bonferroni’s post hoc test (*P < 0.05; #P < 0.05 CYM+SR vs. SR). e Upper panel: Immunofluorescence images of BE(2)C cells treated with 1 μM SR59230A for 48 h, in presence or not of 10 μM CYM5520 and stained with anti-Map2 antibody, Alexa-fluor488 secondary antibodies and propidium iodide (PI). Images are representative of three independent experiments with similar results. Scale bar 25 µm. Lower panel: Quantification of Map2-associated fluorescence intensity normalized to PI, fold change above control set as 1. Data are mean ± SD of six fields of each specimen quantified in three independent experiments. SR59230A increases Map2 in a statistically significant manner by one-way ANOVA (*P < 0.05); the pharmacological activation of S1P2 by CYM5520 abolishes SR59230A-induced increase of Map2 in a statistically significant manner by two-way ANOVA followed by Bonferroni's post hoc test #P < 0.05. f Upper panel: Immunofluorescence images of BE(2)C cells treated with 1 μM SR59230A for 72 h, in presence or not of 10 μM CYM5520 and stained with anti-Neurofilament antibody, Alexa-fluor488 secondary antibodies and PI. Images are representative of three independent experiments with similar results. Scale bar 25 µm. Lower panel: Quantification of Neurofilament-associated fluorescence intensity normalized to PI, fold change above control set as 1. Data are reported as mean ± SD as described above in section e. SR59230A increases Neurofilament in a statistically significant manner by one-way ANOVA (***P < 0.001); the pharmacological activation of S1P2 by CYM5520 abolishes SR59230A-induced increase of Neurofilament in a statistically significant way by two-way ANOVA followed by Bonferroni's post hoc test (###P < 0.001)

