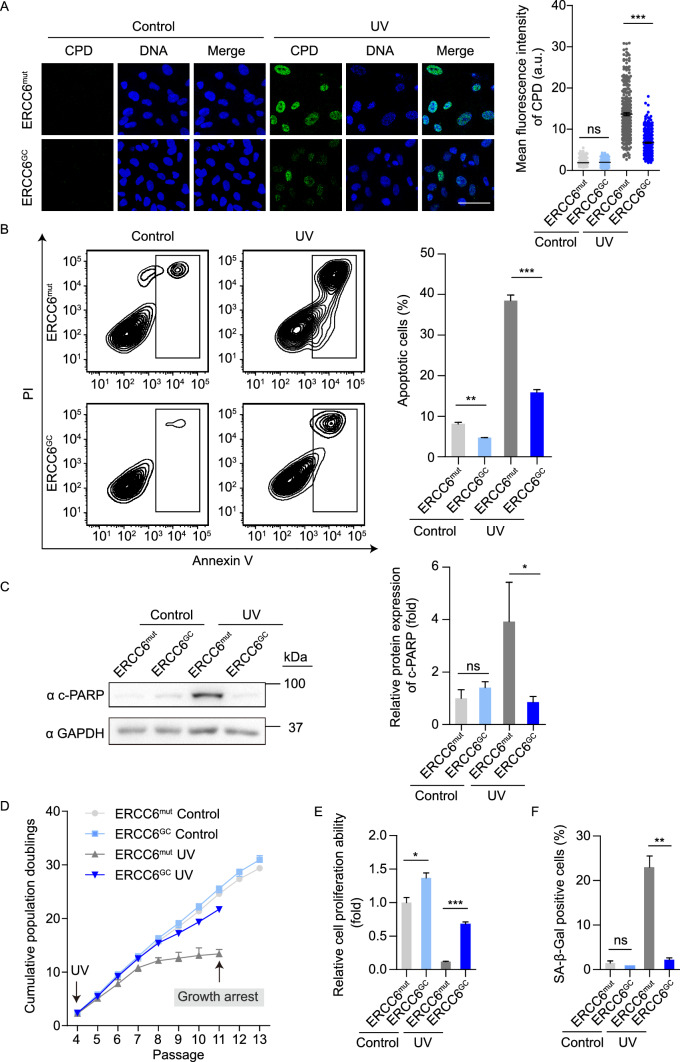
Figure 4.
Gene-corrected CS-MSCs display recovered DNA repair ability and counteract UV-induced apoptosis and senescence. (A) CPD immunostaining in CS-MSCs and GC-MSCs in the absence or presence of 10 J/m2 UV exposure. Nuclei were stained with Hoechst 33342. Scale bar, 50 μm. More than 300 nuclei for each group were used for calculation. The data are shown as the mean ± SEM, ns, not significant, ***P < 0.001. a.u., arbitrary units. (B) Apoptosis analysis of CS-MSCs and GC-MSCs at 48 h after 10 J/m2 UV irradiation. Quantitative data are presented as the mean ± SEM, n = 3, **P < 0.01, ***P < 0.001. (C) Western blots showing PARP cleavage in CS-MSCs and GC-MSCs in the absence or presence of 10 J/m2 UV exposure. GAPDH was used as a loading control. Quantitative data are presented as the mean ± SD, n = 3, ns, not significant, *P < 0.05. (D) Growth curves showing the cumulative population doublings of CS-MSCs and GC-MSCs in the absence (control) or presence (UV) of 1 J/m2 UV exposure at each passage starting from passage 4. (E) Clonal expansion assay showing the cell proliferation ability of CS-MSCs and GC-MSCs in the absence (control) or presence (UV) of 1 J/m2 UV exposure at passage 10. The cells were stained with crystal violet after two weeks of culture, and the relative intensity of the crystal violet staining was quantified. Data are presented as the mean ± SEM, n = 3, *P < 0.05, ***P < 0.001. (F) SA-β-Gal staining of CS-MSCs and GC-MSCs in the absence (control) or presence (UV) of 1 J/m2 UV exposure at passage 10. The percentages of SA-β-Gal-positive cells are shown in the right panel. Data are presented as the mean ± SEM, n = 3, **P < 0.01, ns, not significant

