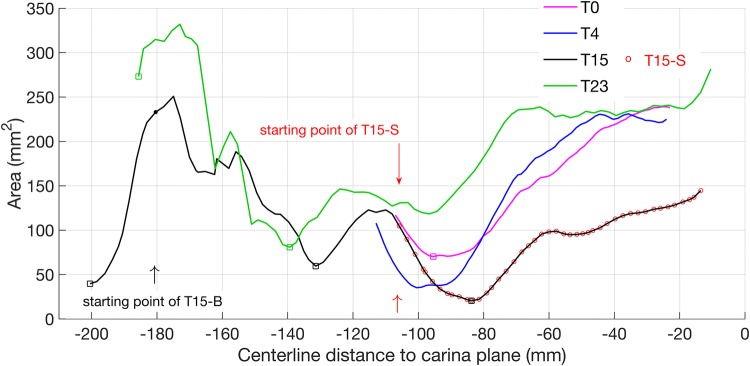
Figure 2.
Line plots of cross-sectional area distribution for all geometries. The three square markers on the curve for T15 correspond to cross sectional area minima: from left to right of x-axis these minima are at the base of tongue (≈ x = − 200, glottis, x ≈ − 135 and overall minimum area x ≈ − 85). In addition, the circles overlapped with the T15 curve represent the extent of a truncated T15 geometry created to compare with that at T4. Geometry T23 does not extend superiorly quite as far as T15 and has minimum area at the glottis, square marker at ≈ − 140.

