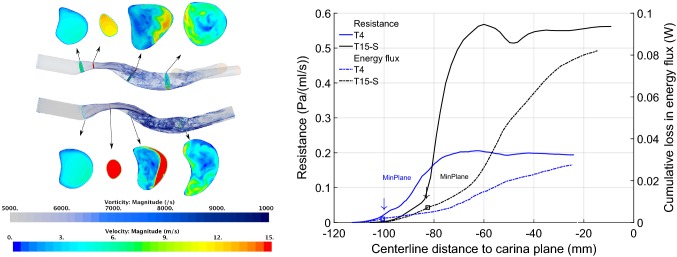
Figure 4.
Left: comparison of vorticity and velocity for geometries T4 and T15-S. Cross-sectional planes indicate velocity distribution; volume rendering reveals vorticity magnitude, highlighting regions of disturbed flow. Right: resistance and energy flux comparison for truncated tracheal geometries.

