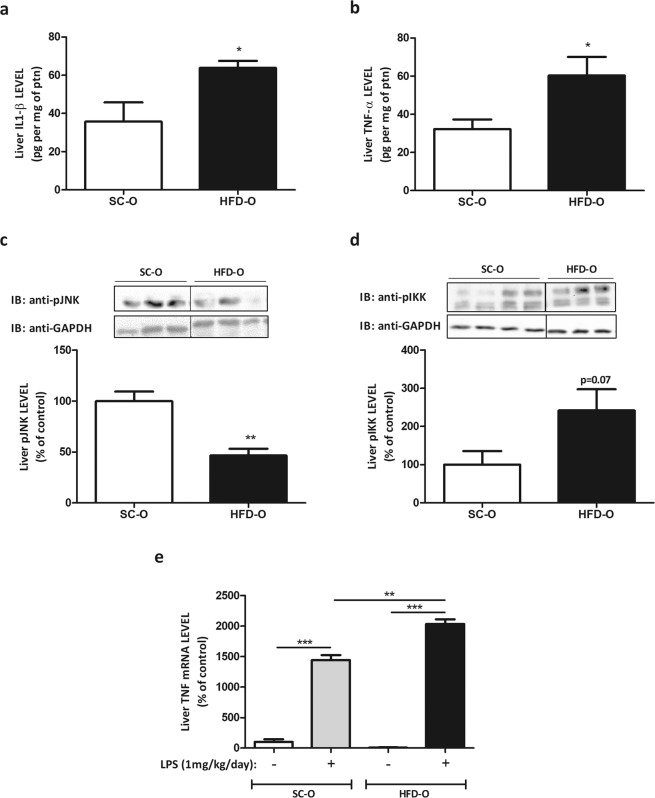
Figure 2.
Cytokine expression in offspring’s liver. Hepatic IL1-β (a), TNF-α (b), pJNK (c) and pIKK (d) protein levels were evaluated by ELISA and Western blot in control and obese dams’ offspring (P28). The expression of the cytokines is shown per mg of protein content. Hepatic TNF-α (e) mRNA levels were evaluated by RT-PCR in control and obese dams’ offspring (P28) after treatment with LPS i.p. 1 mg per kg body weight for 72 hours. The percent expression of control (GAPDH) is shown (means ± SD, n = 5 pups per group). Black line of gel (Fig. 2c,d) indicates that gels/blots were cropped from different parts of the same gel. Statistical significance was analysed by ANOVA and Bonferroni post-hoc tests (*p < 0.05, **p < 0.01, ***p < 0.001), or Student’s t-test for analysis of two groups (p = 0.07).

