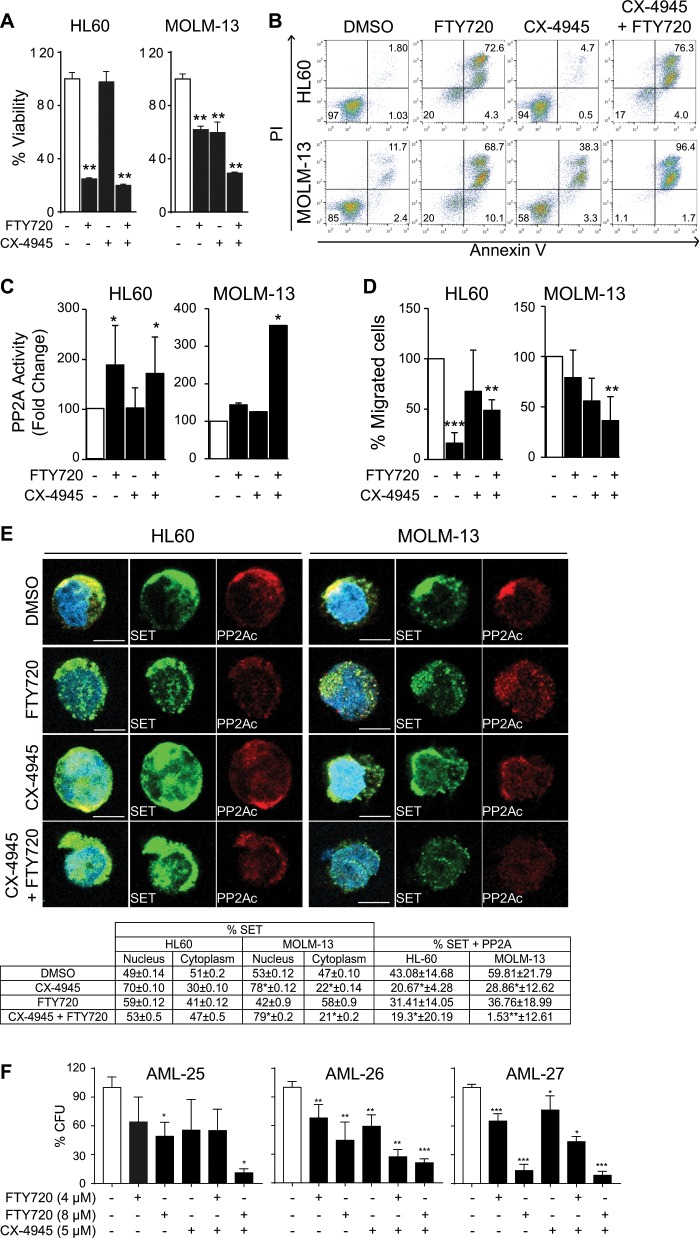
Fig. 6. CX-4945 and FTY720 combination therapy induces apoptosis in AML cell lines and primary patient samples.
HL60 and MOLM-13 cells pretreated for 4 h with CX-4945 (5 µM) and then treated for 24 h with FTY720 (5 µM). a Cell viability was measured by MTS analysis. The results are corrected by the DMSO control and are expressed as fold-change of the control, which are assigned a value of 1 and are mean values ± SEM. b FACS analysis of apoptosis in HL60 and MOLM-13 cell lines stained with propidium iodide (PI) and Annexin V. The percentages of viable and apoptotic cells are indicated. c PP2A activity analysis performed by immunoprecipitation and activity assay. d Migration of HL60 and MOLM-13 placed in the upper well of a 8.0 μM transwell plate in RPMI without FBS. The lower chamber contained RPMI supplemented with 10% FBS. Migration assay was performed for 3 h and then assessed for cell number using flow cytometry e Immunofluorescence analysis of SET (green) and PP2A (red) and quantification table of % colocalization between red fluorescence (PP2A) and green fluorescence (SET) and % of green fluorescence (SET) in nucleus and cytoplasm. Nuclei were stained with DAPI. Immunofluorescences were visualized by confocal microscopy. Scale bar represents 5 µm. Experiments were performed in triplicate four times. *p < 0.05, **p < 0.01. f AML patient samples were cultured in semisolid medium and treated with CX-4945 (5 µM) and FTY720 (4 and 8 µM), alone or in combination. Colony formation units (CFU) were counted 12 days after seeding. Graphs of counted CFU represented as percentage of CFU related to the control, which are assigned the total CFU (100%) and are mean values ± SEM.

